simulating Metrigear Vector cadence extraction (pt 2)
Back to modeling the Metrigear Vector with my little Perl scripts...
First I modeled the "inputs". I assumed vertical acceleration noise, affecting each pedal together, was around 1 g peak amplitude. I neglected internal modes, which I assume are too high frequency to affect the signal. So my vibration signals were simular to those described in this post.
For longitudinal noise, also affecting each pedal together, I assumed less amplitude: around 0.5 g.
I then added an additional noise component which affects each pedal independently, assuming a peak amplitude of around 0.25 g. Honestly I pulled this number out of thin air. Microaccelerometers typically have a noise density measured in the tens of micro-g's per root Hz. Electronic noise on the accelerometers isn't an issue, unless they're terribly starved for current. So the noise would have to be an actual acceleration noise. For example, crank flex would change the orientation of the spindles relative to each other. But crank flex is relatively small: for example 3 mm peak-to-valley. For this to yield 0.25 g requires a component with this amplitude at 6.5 Hz. Typical pedal rotation rates are around 2 Hz in a sprint. So 0.25 g seems on the high side for this sort of differential acceleration noise. But I'll intentionally overshoot, as maybe I'm overlooking something, and I want see how well I can do even with pessimistic assumptions.
This last component is really the one that matters most. The other two ideally get canceled in the averaging. However, noise in the vertical and horizontal acceleration will affect the orientation determination, and an error in orientation makes the averaging imperfect (some leaks through). So I plot a sample distribution of noise values in the following plot. I've succeeded in generating a distribution which is essentially confined to the ±0.25 g range.
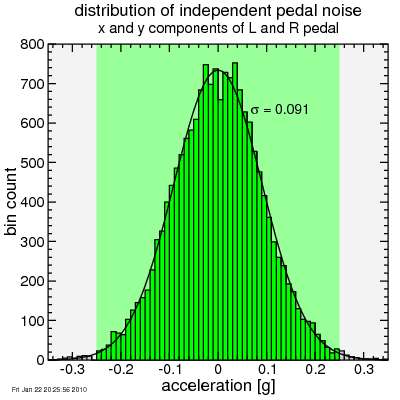 Histogram of pedal-independent noise components
On top of these I added a acceleration associated with bike motion. I assumed the rider did not shift, so bike speed tracked cadence. I neglect accelerations from the bike leaning or turning. Consider these part of the "noise".
So then I modeled the "outputs". I first have the system try and orient each pedal, not initially knowing how they're oriented. Then I extract the radial acceleration components. Then I average these, as I described, and extract the cadence.
I ran this simulation multiple times, in each case with the left and right pedals given a new random orientation. Additionally, the noise components were re-randomized in each case. Here's the results of five of these runs:
 simulated Metrigear cadence, with "actual" cadence plotted in black
This is quite interesting! You can see the rider starts to pedal slowly. It takes a few pedal strokes for the "virtual" Vector to lock in on the spindle orientations. But remember it probably doesn't need to do this every ride. Just every time the pedals are adjusted or moved.
Once it figures out the orientation, it does quite well as long as cadence is above 30 rpm. Below this cadence, the orbital acceleration of the pedals is relatively small in magnitude, and the noise (which I've associated with really bad crank flex, but here may be other sources) becomes more significant. As rpm's increase though, it tracks very well.
This isn't hard to understand. I'm assuming 172.5 mm cranks. So at a cadence of 36, the orbital acceleration is 0.25 g, which is the peak amplitude of the noise. So when the cadence rises much above 36, the noise becomes a relatively small perturbation to the ideal radial acceleration. The good news is if cadence is this low, things are changing fairly slowly, so the data could be "smartly" smoothed to reduce the influence of the noise. My algorithm isn't that smart, however, not yet, anyway.
Of course, the rub is that I arbitrarily picked 0.25 g for this differential acceleration. Better to use real data, of course.
I'll take a closer quantitative look at these results next time, and see if they're good enough to hit a 1.5% accuracy target. I think it's fair to say it looks pretty good.
First I modeled the "inputs". I assumed vertical acceleration noise, affecting each pedal together, was around 1 g peak amplitude. I neglected internal modes, which I assume are too high frequency to affect the signal. So my vibration signals were simular to those described in this post.
For longitudinal noise, also affecting each pedal together, I assumed less amplitude: around 0.5 g.
I then added an additional noise component which affects each pedal independently, assuming a peak amplitude of around 0.25 g. Honestly I pulled this number out of thin air. Microaccelerometers typically have a noise density measured in the tens of micro-g's per root Hz. Electronic noise on the accelerometers isn't an issue, unless they're terribly starved for current. So the noise would have to be an actual acceleration noise. For example, crank flex would change the orientation of the spindles relative to each other. But crank flex is relatively small: for example 3 mm peak-to-valley. For this to yield 0.25 g requires a component with this amplitude at 6.5 Hz. Typical pedal rotation rates are around 2 Hz in a sprint. So 0.25 g seems on the high side for this sort of differential acceleration noise. But I'll intentionally overshoot, as maybe I'm overlooking something, and I want see how well I can do even with pessimistic assumptions.
This last component is really the one that matters most. The other two ideally get canceled in the averaging. However, noise in the vertical and horizontal acceleration will affect the orientation determination, and an error in orientation makes the averaging imperfect (some leaks through). So I plot a sample distribution of noise values in the following plot. I've succeeded in generating a distribution which is essentially confined to the ±0.25 g range.
Histogram of pedal-independent noise componentsOn top of these I added a acceleration associated with bike motion. I assumed the rider did not shift, so bike speed tracked cadence. I neglect accelerations from the bike leaning or turning. Consider these part of the "noise".
So then I modeled the "outputs". I first have the system try and orient each pedal, not initially knowing how they're oriented. Then I extract the radial acceleration components. Then I average these, as I described, and extract the cadence.
I ran this simulation multiple times, in each case with the left and right pedals given a new random orientation. Additionally, the noise components were re-randomized in each case. Here's the results of five of these runs:
simulated Metrigear cadence, with "actual" cadence plotted in blackThis is quite interesting! You can see the rider starts to pedal slowly. It takes a few pedal strokes for the "virtual" Vector to lock in on the spindle orientations. But remember it probably doesn't need to do this every ride. Just every time the pedals are adjusted or moved.
Once it figures out the orientation, it does quite well as long as cadence is above 30 rpm. Below this cadence, the orbital acceleration of the pedals is relatively small in magnitude, and the noise (which I've associated with really bad crank flex, but here may be other sources) becomes more significant. As rpm's increase though, it tracks very well.
This isn't hard to understand. I'm assuming 172.5 mm cranks. So at a cadence of 36, the orbital acceleration is 0.25 g, which is the peak amplitude of the noise. So when the cadence rises much above 36, the noise becomes a relatively small perturbation to the ideal radial acceleration. The good news is if cadence is this low, things are changing fairly slowly, so the data could be "smartly" smoothed to reduce the influence of the noise. My algorithm isn't that smart, however, not yet, anyway.
Of course, the rub is that I arbitrarily picked 0.25 g for this differential acceleration. Better to use real data, of course.
I'll take a closer quantitative look at these results next time, and see if they're good enough to hit a 1.5% accuracy target. I think it's fair to say it looks pretty good.


Comments
The easiest way to "prove" or test your filtering would be strap your iphone to the cranks and record some accelerometer data and run IT through the filter...
g
1. The key thing is the correlation between the L & R cranks, with each component analyzed separately. So I'd need two iPhones (two more than I currently have... too cheap to pay a $1/day data fee :)), and then make sure they're carefully alignen.
2. The phones would need to be well secured, so vibrations were the vibration of the crank, and not vibrations of the phone relative to the crank.
3. The phones, being massive, would reduce the frequency of vibrational modes of the crank-pedal system.
So the best approach would be to use Metrigear Vectors for the test. My number of Metrigear Vectors equals my number of iPhones, and if I had Metrigear Vectors, I likely wouldn't be allowed to publicly disclose either the data or conclusions reached from the data.
(btw, ipod Touch works just as well)
2) easy to do with electical tape :D
3) the phone and the ipod touch aren't "massive" - my gen1 ipod Touch weights a whopping 119g...
:D
g