Posts

Showing posts from 2012

blog posts per year: a numerical model

Image
Many commercial blogs post year-end summaries as a way to boost hits. This blog is non-commercial so I can't be bothered with year-end summaries. But it is a good opportunity to see how my year-end flurry of posts affected my posting statistics. First, an update of my posts per month. Here's the plot. I had a weak period for much of the year but had a nice come-back in October through year-end: Next, I plot the total posts per year: After I started posting in 2008, early enthusiasm caused a peak in 2010 followed by a two-year decline. This pattern is fairly common, I find. I did a numerical fit using the following formula: posts/year = 190.1 (year - 2007.89) exp[(2008 − year) / 2.078] This seems to do a good job of capturing the trend. To stay on the trend line I need around 88 posts for 2013.
Pat McQuaid must go

Image
CyclingNews just published an article of quotes from Pat McQuaid, the President of the Union Cycliste Internationale (UCI), the organization which oversees international cycling ( McQuaid: All I've done since I became president is fight doping ). Where to begin? Some of the ways McQuaid has been "fighting doping": Trying to take over the USADA case against Lance Armstrong, claiming it had no merit, then trying to rush USADA into submitting its evidence early Filing lawsuits against Floyd Landis and Paul Kimmage, each of whom reported the UCI appeared to be complicit in covering up Armstrong positives. Armstrong's $125k donation to the UCI still goes officially unexplained. Calling "scumbags" riders who came forward with evidence against doping at US Postal and Discovery. Attacking Dick Pound , the then-head of the World Anti-Doping Agency, who had called for stricter anti-doping efforts in cycling and who had correctly claimed cycling had a doping pr

fitting pro cyclist setback data, and forward-offset seat tubes

Image
Selected pro cyclist setback data was posted on the WeightWeenies forum. The data are summarized in this spreadsheet . Setback is measured to the tip of the saddle, while saddle height is measured to the top of the saddle. I converted setback to a value Δx, which is the position of the saddle center relative to the bottom bracket, where typical Δx < 0, using a 14-cm tip-to-center measurement from my stripped down SLR. I did a least-square fit of Δx versus saddle height, using as my fitting parameters the angle (measured in the same way seat angle is measured) and the offset. So if I wanted to build a bike which fit the riders the best, minimizing the root-mean-square adjustment of saddle position on the rails, I would use a seat tube angle of the listed angle and a seat tube set-back of the negative of the intercept x 0 . Here's the result: This is perhaps surprising: the angle is a super-slack 66.4 degrees and the saddle set-back is -93.5 mm. The RMS error is then 16

using the analytic running-mass model

Image
It's always risky to use analytic models I develop here in follow-up posts because I have too great a rate of changing my mind about analytic models, and in these cases I face the prospect of revising not only the model but also subsequent posts relying on the models, and these dependencies are not tracked. But I'll boldly forge ahead here. Note already my model is suspicious because it predicted a substantially higher dependence on shoe mass than what is reported from experimental measurements, so interpret these conclusions with caution. First, I'll look at the cadence dependence of the different energy components: Force versus cadence The potential energy component associated with bouncing the center-of-mass dominates at low cadence. As the cadence increases, two other contributions increase in importance: the potential energy of kicking the foot up, the the kinetic energy of swinging the foot forward. Additionally, the faster the cadence the more energy return f

analytic running power-speed model, revisted

Image
In a previous post in April 2010, I made an effort to model running power. I recently realized in looking back on this (actually, in reflecting on a comment in Runner's World on the claimed difference between running on the road versus a treadmill) that I'd made an error in doing so in neglecting foot kinetic energy. I admit it's embarrassing when I do calculations on things and post them here then much later realize I'd made such a glaring error. If I were to spend train commuting time doing Sudoku instead my errors would be more private. In any case, the model I used was the following. I considered running in the inertial frame of the runner. In the absence of wind, this is a valid frame of reference. First I considered the trajectory of the center of mass when the runner is ballistic, which results in the following relation between potential energy change (ΔU) and time from launch to apogee (t): ΔU = ½ M g² t², where M is total mass. I then assumed the bo

height of effective wind speed when running (more post-CIM analysis)

Image
I've been modeling the wind speed as a function of height with the Hellman formula : v w = v w0 ( h / 10 meters ) α With this dependence, I need to integrate the wind speed over the full height of the body, assuming the effective C D dA per unit height is the same (in a constant wind, the force per unit height is the same). I got this result for the total force from the wind resistance: The Hellman formula assumes wind exactly at ground level is zero. Wind speed then increases to the top of the head. Somewhere in between the wind speed is the value which can be applied to the constant wind formula for wind resistance: F W = ½ ρ C D A (v +v weff ) 2 Here v weff is the effective headwind speed. The question I'll ask here is at what fraction of the runner's height does the wind speed equal v weff ? Consider the case where the wind varies linearly with height, and where the net wind resistance is linearly dependent on the wind speed (for example, the wind

effect of gusting vs steady wind on running wind resistance @ CIM

Image
One limitation of my analysis of wind in CIM was my assumption of uniform wind speed. It isn't hard to investigate how gusting wind would affect the result, however. While the actual time-dependence of wind is complex, a simplistic assumption can at least establish the bounds for what uncertainy exists. So I make a small perturbation to the assumption of uniform wind speed. Instead, I assume the wind is either zero, or a non-zero "gusting" value which is some multiple k of the average. Since the average is fixed, the wind is zero for a fraction of the time (1 - 1/k), and it is gusting for a fraction 1/k. So with the same derived average wind speed, I changed the constant k. As before, I assume the wind speed is characteristic of a 10 meter elevation above ground level. I assumed the Hellman formula for the reduction in wind speed as a function of position closer to the ground. I then integrated wind resistance over my height in shoes (170 cm). Before showing res

Garmin Forerunner 610 vs Edge 500: city run smack-down

Image
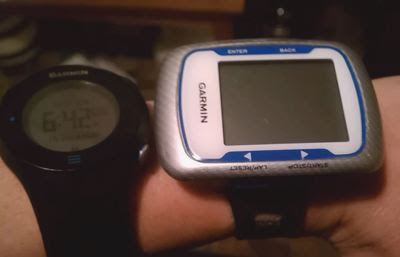
Previously I compared the Strava Android app on my HTC Incredible phone to the Garmin Forerunner 610 on a run I did along the Steven's Creek Trail. I thought the phone might have been slightly better, but it was close. This time I set off for a city ride without my phone, but I had the Garmin Edge 500 mounted with a strap to my right wrist, and I had the Garmin Forerunner 610 mounted to my left wrist with its integrated strap. I had both set to 1-second sampling. This wasn't a pure run, as I was also Christmas shopping (books for my nieces). So I stopped in several book stores along the way, as well as a two cellular phone shops (thinking of switching from Verizon to T-Mobile), one bike shop (the black-on-black Specialized SL4 with 2012 Red is very slick), and a chocolate shop (disappointed Girardelli's "sea salt" "Intense Dark" doesn't seem so dark at all from the fat:carbohydrate ratio). Anyway, all of these stops meant loss of signal. Here&

Garmin Forerunner 610 "Smart Sampling" test

Image
I recently did a run using both my new Garmin Forerunner 610 and the Strava Android app running on my HTC Incredible phone. I hadn't yet gone through the set-up menus on the Garmin so settings were still mostly default. This included "smart sampling" which reduces file sizes by recording data only when the watch decides it is important to do so based on the goal of being able to accurately reproduce the course. The Strava app takes a different approach to file size reduction: it attempts to sample at 3-second intervals unless data signal is lost or unless the runner is idle. It's thus less "smart". I've shown for cycling that "smart sampling" can yield significant errors in Strava times for segments since Strava doesn't interpolate positions and is therefore limited to times equal to a difference between samples. So if a 6-second gap, for example, appears in data Strava will have two choices for time on a segment, separated by 6 seco

Estimating effect of the wind on run speed @ CIM 2012

Image
The big factor I've not addressed in the conditions at CIM was the wind. There was a strong wind from the south, and the route finished further south than it began. It was fairly W-to-E or N-to-S at all time, moving along orthogonal trajectories. The latitudes reported by my Edge 500 extended from 38.564 degrees to 38.704 degrees, a difference of 0.140 degrees, which at 90 degrees per 10 million meters yields 15.51 km north-to-south out of the 42.2 km race. So the question is, given the conditions of the race, how much time is added by running 15.51 km of the course into a block head-wind? I assume a side-wind had no effect. Weather reports of wind are generally typical of 10 meter elevation, and I extend only from 0 to 1.70 meters (in shoes). Approaching ground level, wind speed is reduced. An analytic approximation to this effect which I have used before is the Hellman formula : v w = v w0 ( h / 10 meters ) α Assuming all increments in height have essentially equa

Garmin Forerunner 610

Image
At the Low-Key Hillclimbs awards party this year, I received an extremely generous gift from some friends this Christmas: a Garmin Forerunner 610 . They had observed I'd been running with my Edge 500 coupled with a Garmin wrist strap, a functional if somewhat klunky solution to on-the-run GPS. In the rain at CIM it wasn't easy for me to see the Edge 500 screen: water droplets and low ambient light made for poor viewing conditions. So I decided early on to run blind: go on perceived exertion. This made sense to me in any case since, lacking any training data in the wet and windy conditions, I didn't know what my target pace should be anyway. So after getting a 5 km split, I allowed the Edge to flop upside down on my forearm where it was located (I had a gel under my compression sleeve which occupied the normal watch position). I left it there to collect data silently for post-run analysis (it was issuing beeps every 5 km, but during the constant rain of the run I didn

"units" program for running/marathon time calculations

I've been doing a lot of calculations about marathon pacing and times and I wanted to document my favorite method for doing that. It's the venerable unix code "units", which is provided with Mac OS/X. There's various GUIs provided for this code, or for other unit converters, but it's the command-line version which is the most powerful. I suspect most users of units fail to appreciate it's power. For example, they might want to convert km to miles (or back). For that, I type: > units Currency exchange rates from 2012-06-06 2546 units, 85 prefixes, 66 nonlinear units You have: km You want: miles * 0.62137119 / 1.609344 I see that 1 km is 0.62 miles, with a reciprical conversion of 1.61 km per mile. Or you can just convert a unit to a basis unit, as follows: You have: km You want: Definition: kilo m = 1000 m You have: miles You want: Definition: mile = 5280 ft = 1609.344 m The internal unit for distance is meters, so the code provides t

CIM: more thoughts about speed, water, the marginal elastic efficiency of shoes, shoe mass

The last post, I somewhat dubiously estimated the effect of accelerating ground water from under-shoe during footstrokes. I concluded the kinetic energy was potentially a significant form of energy dissipation. But this is an absolute upper-bound estimate. After all, when considering energy dissipation, one must consider what would happen to the energy if it were not dissipated in water. For example, it might simply be dissipated in the sole of the shoe, in leg muscles and tendons. If this were the case, the total energy dissipation would be the same. Whether the energy would be dissipated in the shoe sole or in the water wouldn't affect speed. You could even argue the water would improve endurance by cushioning the landing, decreasing wear and tear on the body. The question is what the marginal elastic efficiency of foot strikes on the road. When the foot hits the pavement the sole compresses, absorbing some of the kinetic energy. More kinetic is absorbed by the body.

CIM: theoretical time delay from water

Image
Last few posts I documented that, for whatever reason, average times were slower in the 2012 CIM then in the previous 11 years. The year prior, 2001, times were about the same as 2012. Your response might be "Well duh! The weather was appalling both in 2001 and 2012: it rained." But 2012 certainly wasn't bad enough that hypothermia was a concern, or that the rain was so strong that the mechanical action of running was a challenge. It should be possible to estimate why a runner, running at the same metabolic rate, would go slower in the conditions. There are two candiates for slower speeds: the wind and the rain. I'll start with the rain. The rain presents two mechanisms for increased resistance: hitting drops in the air and displacing water on the ground. I'll consider each of these. First, displacing drops in the air. If it is raining at a rate R (a rate of precipitation per unit time), then if air droplets are falling at an average speed v r , and if

CIM time comparison: 2011 versus 2012

Image
I downloaded the 2011 and 2012 complete results via the CIM website so I could do a more detailed time analysis. After all, the averages were slower this year, but how did this compare for different types of runners? For example, were faster and slower runners both slower, and if so, by the same fraction? Since there was a different number of runners in the two years, I converted ranking (based on chip time) into a number from 0 to 1. I created bins for each runner and gave him the number representing the center of the bin. So, for example, if there had been two runners, they would receive rankings 0.25 and 0.75. I chose 1000 values in the range 0 to 1 (0.0005, 0.0015, 0.0025, ..., 0.9985, 0.9995) and interpolated the times for each of these normalized rankings for each year. Then I took the difference, in minutes. I plot this versus the 2012 time here: I noted the time difference tended to be proportional to time, and I fit a line through the data with a single fitting par

CIM: finish statistics 2000-2012

Image
My races this year have been a series of just-missing goals, then rationalizing why conditions were such that under "normal" circumstances I could have met them. I'm not very happy with that: goals are goals, they are not conditional upon the best-case scenario, and in the case of CIM my initial goal was 3:15, with a back-up of 3:25 and a "reach" goal of 3:10. However, when conditions were for strong rains and heavy southern winds, I honestly had to let these goals slip a bit: it was enough just to motivate myself to set off in these rather epic conditions, let alone pulling off some sort of target time in what was my first-ever road marathon. Part of the negotiation process was, "okay, I'll do the race, but don't try and tell me I failed because I was too slow." Despite this, once I got going I felt good, and the conditions while arguably slower didn't feel particularly bad. I say that as I sit here recovering from a cold which I &quo

2012 CIM speed analysis

Image
In my run story, I recalled that at 17 miles I started feeling pain in my left foot. I tried to relax that out, stopping twice to adjust my compression calf sleeve, until at near mile 18 I was inspired by "Eye of the Tiger" and rallied a bit. I was then able to continue until mile 20 when I started feeling pain in my right leg, as well, and from here it was pretty much suffer-fest for the final 10 km. I decided to examine the data to see if this story was consistent with the Garmin Edge 500's story. I plotted speed, which I smoothed with a Gaussian of sigma 100 meters, and plotted it versus distance. Here's the result: Until 27.1 km (16.8 miles) my pace shows little sign of fading, running along at near a 3:15 pace (which had been my target). There was a period in there from around 5 to 12 km where I was a bit faster than this, but this was an extended gradual downhill, so it was natural I was a bit faster. And there might have been a bit of a fade from ki

split times at CIM

At CIM, I went out at what I felt was a completely sustainable pace. I barely felt the strain, running along with the crowd, not thinking about deadlines, until I got to the 5 km point and looked at my Garmin and saw I was right on schedule (despite the conditions). This wasn't bad, because there were headwind sections ahead, and this preserved my buffer against Boston qualifying for when I'd likely really need it. Yet despite this my legs let me down and my pace faded, first at 17 miles, but then further at 20 miles, although I seemed to limit the explicit damage to two discrete steps, rather than a steady decay into oblivion. Here are my splits against Ron, a coworker and an experienced marathoner who usually runs sub-3 hours. I view him as a good model, someone clearly faster than me but not so much so he's in a completely different class: first second third fourth total Ron: 00:40:31 00:51:04 00:47:59 00:45:14 03:04:36 Me: 00:42:50 00:54:37 00:54:1