2012 CIM speed analysis
In my run story, I recalled that at 17 miles I started feeling pain in my left foot. I tried to relax that out, stopping twice to adjust my compression calf sleeve, until at near mile 18 I was inspired by "Eye of the Tiger" and rallied a bit. I was then able to continue until mile 20 when I started feeling pain in my right leg, as well, and from here it was pretty much suffer-fest for the final 10 km.
I decided to examine the data to see if this story was consistent with the Garmin Edge 500's story. I plotted speed, which I smoothed with a Gaussian of sigma 100 meters, and plotted it versus distance. Here's the result:
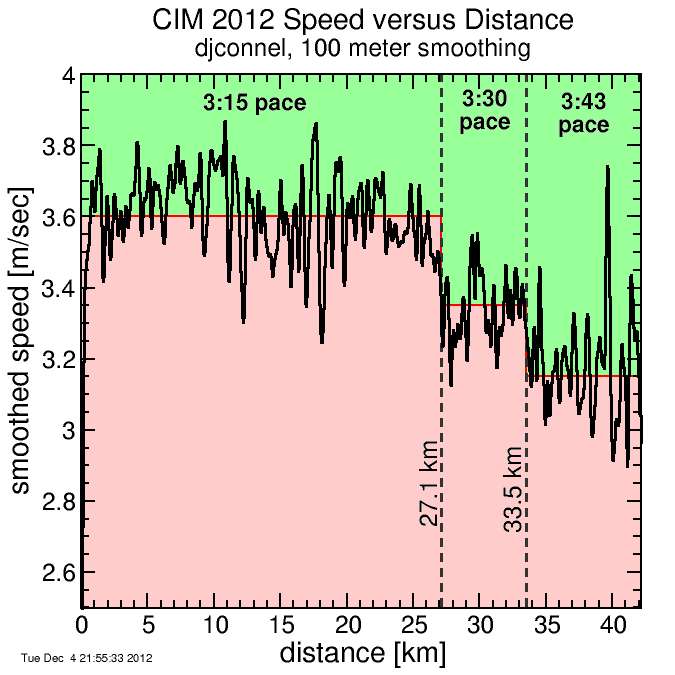
Until 27.1 km (16.8 miles) my pace shows little sign of fading, running along at near a 3:15 pace (which had been my target). There was a period in there from around 5 to 12 km where I was a bit faster than this, but this was an extended gradual downhill, so it was natural I was a bit faster. And there might have been a bit of a fade from kilometers 22 to 27 before the first big slow-down, but kms 22 to 25 were due south, into the strong headwind.
So things were looking okay. I seemed set to make my goal.
But then you can see my speed took a big hit during kms 27-29. There, at mile 18, I rallied slightly before reality set in and I went back to a diminished pace, still hovering around a 3:30 marathon.
Then I took another speed hit at 33.5 kms (20.8 miles). This was actually the start of an uphill, so it may not have been the sign of a problem, but when the hill topped out at km 35, my speed picks up a bit but then crashes back down. This is mile 21.7, so it was slightly after my right leg started to hurt if my recollection is correct of that happening at mile 20.
From there my pace fluctuates about closer to a 3:43 pace. Now I was losing time versus my goal in big chunks. 3:43 = 28 minutes slower than 3:15, or more than one minute per mile.
The speeds in the plot don't quite add up to my full time, since I am just eyeballing the characteristic speeds here for each of the three sections. The idea here is to extract a meaningful story out of the GPS data. And the story seems pretty clear. I was going well until I got into trouble, but each time I limited my losses and still finished okay, even if I was slower than target.
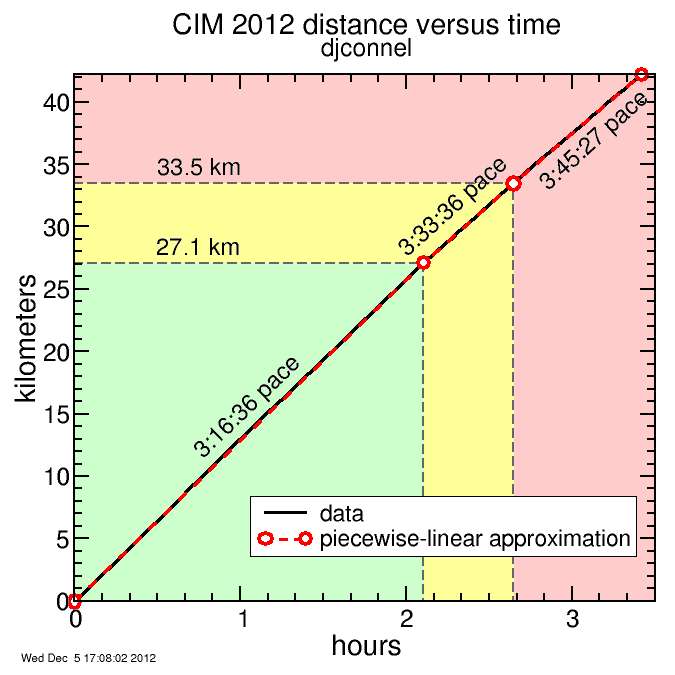
For completeness, here's distance versus time, showing a piece-wise linear approximation with the same transition distances. Paces for each segment are shown. These are true averages, not "typical speeds" determined by eye. In this case, I was 3:16:36 pace for the first 27.1 km, then 3:33:36 pace until 33.5 km, then 3:45:27 pace from there to 42.2 km. Total time is slightly shorter than my official time, perhaps due to differences in distance from nonoptimal lines through corners and/or GPS position noise.
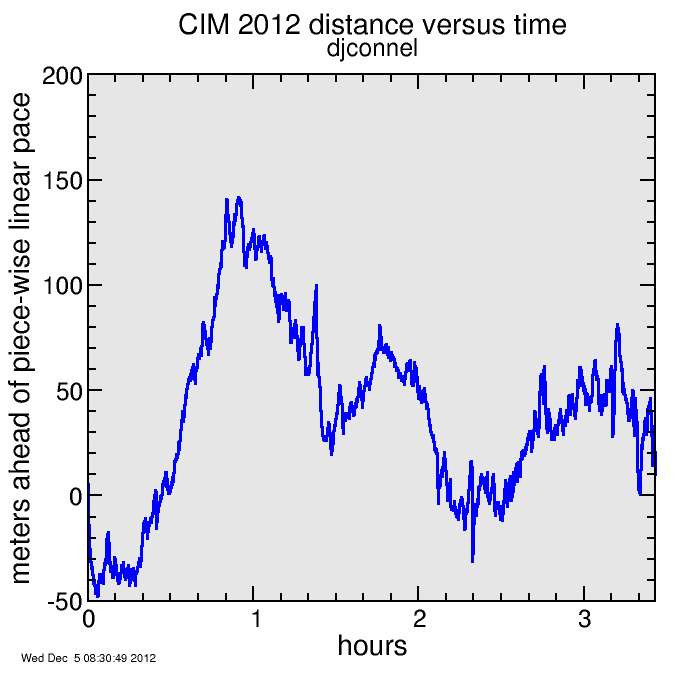
Here is the error of the piecewise-linear approximation: the distance I was ahead of the piecewise-linear pace. Maximum error is around 100 meters, near the bottom of the extended descent.


Comments