Kyle and Berto's drivetrain efficiency data
Last time I discussed Spicer's measurements published in Human Power 50 (2000). The key issue there is that drivetrain efficiency consisted of a component associated with infinite chain tension, plus an additional contribution proportional to the recprocal of chain tension. Each of these terms, the slope and intercept versus 1/tension, depends on some combination of the reciprocals of chainring teeth, cog teeth, and pulley teeth. The problem is for infinite tension, or worst with infinite tension and infinite-sized chainrings and cogs, the extrapolated efficiency exceeded 100%. For example my regressions had a maximum efficiency of 106.6%. Bonanza! The energy crisis is solved!
But onward to other measurements. In Human Power 52, summer 2001, Chester Kyle and Frank Berto published some really nice experiments measuring drivetrain efficiency, of primary interest being those of an Ultegra 3×9 system. They did their measurements with the crank driving the hub, and the hub driving an Al Monarch wheel via a pair of 36-tooth sprockets, one on the non-drive side of the bicycle hub.
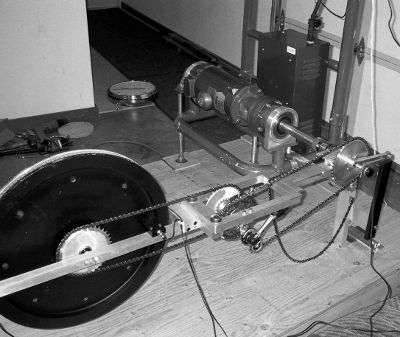
 Kyle and Berto apparatus, from Human Power 52
I'm not exactly sure how it worked, but the ergonometer wheel apparently was resisted by a hanging weight which could be adjusted. They end up with the following equation for work done on the ergonometer wheel in steady-state, where the wheel itself is not accelerating:
P = k ω (T₁ ‒ T₂)
where T₂ is the tension on the slack side of a cord, T₁ is the tension on the side lifting the weight, k is a proportionality constant, and ω is the angular speed at which the wheel is rotating. This is equivalent to the case where there's a pulley, with weight T₁ on one side, and weight T₂ on the other, where the former is raised while the latter is lowered.
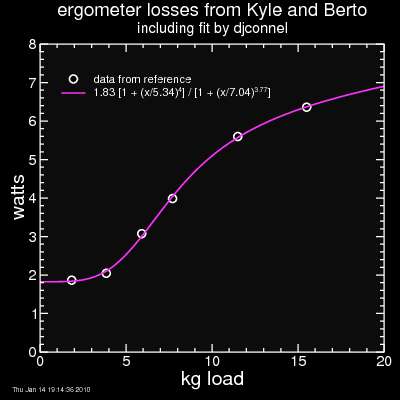
To test the efficiency of the connection between the bicycle hub and the Monarch wheel, they drove the Monarch wheel directly at 75 rpm. This measurement included bottom bracket bearing losses as well, which are considered much smaller than losses in the chain and rear derailleur. In any case, they measured that this second drivetrain at 75 rpm had losses which went from 1.87 W for the lowest measured weight to 6.36 W for the heaviest weight, all when the ergo wheel was spinning at 75 rpm. I reproduce their results here, along with an equation I fit to their data:

As an aside, since all measurements were done at a crank cadence of 75 rpm, the bottom bracket bearing losses should be similar for all cases, so it's simple enough to add the bottom bracket bearing losses back in based on additional measurements.
 from Berto and Kyle
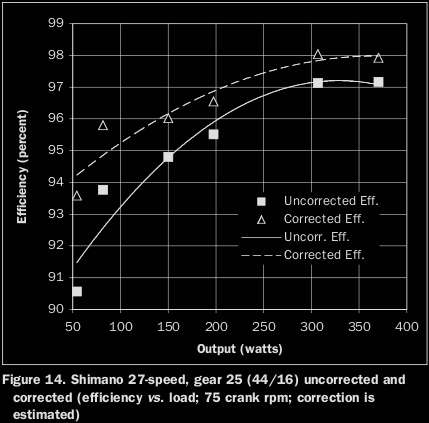
In their Fig 14, they use these measurements to correct data measured including the Ultegra drivetrain. The crank is turning at 75 rpm with a 44-tooth chainring and a 16 tooth cog. This means the ergonometer is spinning at 44 / 16 × 75 rpm. Losses in the ergonometer drivetrain should therefore be at least 44 / 16 × 1.87 watts = 5.1 watts. At the lowest drivetrain power, 50 watts, you should therefore add at least 5.1 watts to the "transmitted" power in calculating the efficiency (this measurement likely used their lowest mass, so it should be close to this). Measured efficiency was 90.6% at 54 watts, which means transmitted power was 48.9 watts. I add 5.1 watts and I get 54.0 watts. Thus the "corrected efficiency" is 100%.
But they report the corrected efficiency is only 93.6%. So something's wrong. That represents a change in tramitted power of (93.6% - 90.6%) × 54 watts = 1.62 watts. This is lower even than the lower bound of the 75 rpm (on the ergometer wheel) measurements. It would imply an ergometer wheel rotation rate of 1.62 W / 1.87 W × 75 rpm = 65 rpm.
I'm stumpified, I admit.
Going back to the ergonometer measurements from their Fig. 13: those really are curious. They're curious because the chain tension should be proportional to the mass-load on the Monarch wheel (with an intercept for zero mass). Chain speed and chain bending are both constant since the test was done at a fixed 36/36 gear with a 75 rpm cadence. So by my simple friction model, power dissipated should be a straight line, with an intercept. Yet it's not a straight line, not even close. Is this a clue to the problem with the intercepts on the Spicer data exceeding 100%? If yes, I don't see it. To "save" the Spicer data efficiency needs to stop improving as tension is increased (1/T is decreased) relative to the highest values of T (lowest values of 1/T) used there. That requires power loss start increasing faster at higher tensions, not flatten out as it does in Berto and Kyle's data. Berto and Kyle use a fixed gear, while Spicer was going through a derailleur, but that shouldn't matter in the high-tension limit where the high-tension part of the chain sees only the cog and the chainring.
So I'm still stumpified both by Spicer and by Kyle & Berto.
But onward to other measurements. In Human Power 52, summer 2001, Chester Kyle and Frank Berto published some really nice experiments measuring drivetrain efficiency, of primary interest being those of an Ultegra 3×9 system. They did their measurements with the crank driving the hub, and the hub driving an Al Monarch wheel via a pair of 36-tooth sprockets, one on the non-drive side of the bicycle hub.
 Kyle and Berto apparatus, from Human Power 52
I'm not exactly sure how it worked, but the ergonometer wheel apparently was resisted by a hanging weight which could be adjusted. They end up with the following equation for work done on the ergonometer wheel in steady-state, where the wheel itself is not accelerating:
P = k ω (T₁ ‒ T₂)
where T₂ is the tension on the slack side of a cord, T₁ is the tension on the side lifting the weight, k is a proportionality constant, and ω is the angular speed at which the wheel is rotating. This is equivalent to the case where there's a pulley, with weight T₁ on one side, and weight T₂ on the other, where the former is raised while the latter is lowered.
To test the efficiency of the connection between the bicycle hub and the Monarch wheel, they drove the Monarch wheel directly at 75 rpm. This measurement included bottom bracket bearing losses as well, which are considered much smaller than losses in the chain and rear derailleur. In any case, they measured that this second drivetrain at 75 rpm had losses which went from 1.87 W for the lowest measured weight to 6.36 W for the heaviest weight, all when the ergo wheel was spinning at 75 rpm. I reproduce their results here, along with an equation I fit to their data:

As an aside, since all measurements were done at a crank cadence of 75 rpm, the bottom bracket bearing losses should be similar for all cases, so it's simple enough to add the bottom bracket bearing losses back in based on additional measurements.
 from Berto and Kyle
In their Fig 14, they use these measurements to correct data measured including the Ultegra drivetrain. The crank is turning at 75 rpm with a 44-tooth chainring and a 16 tooth cog. This means the ergonometer is spinning at 44 / 16 × 75 rpm. Losses in the ergonometer drivetrain should therefore be at least 44 / 16 × 1.87 watts = 5.1 watts. At the lowest drivetrain power, 50 watts, you should therefore add at least 5.1 watts to the "transmitted" power in calculating the efficiency (this measurement likely used their lowest mass, so it should be close to this). Measured efficiency was 90.6% at 54 watts, which means transmitted power was 48.9 watts. I add 5.1 watts and I get 54.0 watts. Thus the "corrected efficiency" is 100%.
But they report the corrected efficiency is only 93.6%. So something's wrong. That represents a change in tramitted power of (93.6% - 90.6%) × 54 watts = 1.62 watts. This is lower even than the lower bound of the 75 rpm (on the ergometer wheel) measurements. It would imply an ergometer wheel rotation rate of 1.62 W / 1.87 W × 75 rpm = 65 rpm.
I'm stumpified, I admit.
Going back to the ergonometer measurements from their Fig. 13: those really are curious. They're curious because the chain tension should be proportional to the mass-load on the Monarch wheel (with an intercept for zero mass). Chain speed and chain bending are both constant since the test was done at a fixed 36/36 gear with a 75 rpm cadence. So by my simple friction model, power dissipated should be a straight line, with an intercept. Yet it's not a straight line, not even close. Is this a clue to the problem with the intercepts on the Spicer data exceeding 100%? If yes, I don't see it. To "save" the Spicer data efficiency needs to stop improving as tension is increased (1/T is decreased) relative to the highest values of T (lowest values of 1/T) used there. That requires power loss start increasing faster at higher tensions, not flatten out as it does in Berto and Kyle's data. Berto and Kyle use a fixed gear, while Spicer was going through a derailleur, but that shouldn't matter in the high-tension limit where the high-tension part of the chain sees only the cog and the chainring.
So I'm still stumpified both by Spicer and by Kyle & Berto.

Comments
Look at their Figure 11 plotting the effiency versus the gear number of the Shimano Ultegra 27-speed transmission. The data points lying below the dotted trendline are from left to right: 32/34 - 32/26 - 32/20 - 22/16 - 32/16 - 32/12). Remarkably, all combinations with the 32-chainring have a below-average efficiency. Oddly, gear 22/16 has a higher efficiency (93%) than gear 32/16 (92.5%), although the chain line is more cross. Even more odd, gear 22/12 has a much higher efficiency (91.5%) than gear 32/12 (89.5%) although the chain line is more cross. I believe this is enough reason to dispute the quality of these data.