tracking my running training load
It's been only a bit over two weeks since I tracked my running training load last, but with my first trail race in two and a half years coming up this weekend (how did I let it go so long?) I wanted to update the plot.
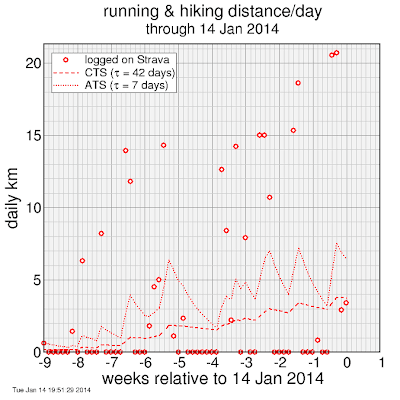
It can be hard to assess how it's going from feel. I run a bunch, rest, run a bunch more, rest... weekly miles tell a story, but only crudely. For a better view I borrowed some metrics from Andrew Coggan, typically applied to calculations from cycling power, ATS and CTS. In lieu of Coggan's effective workload numbers, I use running kilometers. This is crude, but tells a story.
The metrics are a 7-day exponentially weighted average for ATS, and a 42-day exponentially weighted average for CTS. ATS represents fatigue, CTS represents accumulated fitness.
Here's the new plot:
Sure enough, while ATS is spiky, CTS keeps slowly ramping upward. The peak spikes of the ATS are similar, but they're getting closer together.
In addition my runs have been getting a bit faster, which is not indicated on the plot, which is distance only.
Hopefully the race on Saturday goes well.


Comments
One issue is grade-adjusted pace as I've described it in this blog is based primarily on measurements done of CO2 exhalation rate, which implies rate of aerobic work, but there's trauma associated with running downhill which this metric wouldn't capture. Of course one could adjust a grade-adjusted pace formula to capture the eccentric trauma effect, as in an example I've published here (in calculating a scoring adjustment for Low-Key Hillclimb times for runners).
In any case, including altitude in the assessment is clearly justified. I think the error from marginal altitude precision can be handled. Maybe Strava will implement something.