envelope fits using iteratively weighted least-squares regression
I've noted an issue with fitting power-duration curves is that there is a lack of quality data, and the challenge is to focus on the data of the highest quality. Only at a few time durations will the data represent the best possible effort available from the rider, at other durations more power was possible. So to fit a model to the data, what I call an "envelope fit" is wanted. The fitted curve should encapsulate the measured points, hugging the data as closely as possible, such that the points generally form under the curve or on the curve but not above the curve.
I showed for the critical power model, with two parameters, that a reasonable fit to data with sufficient quality can be attained by searching for two "quality points" and doing an exact fit through those points. To independently fit the two parameters, subsets of the available time points are chosen, for example 1-6 minutes for anaerobic work capacity and 10-60 minutes for critical power. This risks ignoring points below 1 minute or in the 6-10 minute range, but the scheme is simplistic and is confused by points in the 6-10 minute range. They are dominated neither by anaerobic work nor by critical power.
I tried applying a similar scheme to a 4-parameter model which I call the "modified Veloclinic model", or just the "Veloclinic model". This model in its original form was described in the Veloclinic blog, and I made a phenomenologically based modification to improve the behavior at long times. However, the fitting scheme I derived was prone to large errors in predicted power where the envelope fell well above the measured points. This is because the fitting scheme is insensitive to how far it is above inferior points: it considers them 100% unreliable. It is sensitive only to the curve touching its four identified "quality points", and the selection of those points is a bit arbitrary.
So what's wanted is a scheme where the inferior points aren't ignored but rather de-weighted. They should be considered, but just considered a lot less than the points of higher quality, that is those points which are higher power relative to the fitted model.
A more common approach to curve fitting is a least-square fit. In least-squares, the fitted curve generally passes through the cloud of measured data, approximately half falling above and half falling below. This is, as I've described, unsuitable for fitting maximal power curves.
A variation on the simple least-squares fit is a weighted least-squares fit. With a weighted fit, some points count more than others. This is equivalent to duplicating points (although the weight can be any real number, and duplicating points would restrict you to weights which are rational numbers). For example, suppose I had points at t = 1 and t = 2, but I wanted the t = 1 point to count twice as much. With a weighted fit it would be equivalent to having two equivalent points at t = 1 and a single point at t = 2.
So it's clear to get an "envelope fit" I want the "quality points" to have a high weight and the other points to have a low weight. I need to determine the weights.
A bad way to determine weights would be to weight by power. The problem with this is that while power is higher for quality points and inferior points at similar time, quality points for long times will still have much lower power than quality points for short times.
Instead I want to weight the points based on how the power compares to the model. For example, if a point has higher power than the model, that point should get a high weight: it becomes a priority to reduce that error. On the other hand if a point has lower power than the model, this is a lesser priority. That point is consistent with the model. It would be better if the model came closer to that point than further, but not if that involves other points moving substantially higher than the model.
The problem with this is you need the weights to derive the model, and the model to derive the weights. So the fit needs to be done iteratively. Hopefully the result converges, rather than bouncing around forever.
The weighting scheme I chose was a simple bimodal weight. If a point is less than the model, then the weight is 1. If the point is higher than the model, the weight is large, for example 1000.
To test this, rather than using complicated power-duration models, I did a simple linear fit. I generated 101 data points from 0 to 100. The ideal value for these points is 0, but I have assigned unit normal perturbations to each point. A least-square fit to the data should be y = a x + b, where a = 0 and b = 0. A numerical fit won't return exactly a = 0 and b = 0, but the results should be close to this. Then to these data I can add iterative weights. What I hope to see is that the fitted curve "floats" to the top of the data, going from a simple least-squares fit to an envelope fit.
Here's the result:
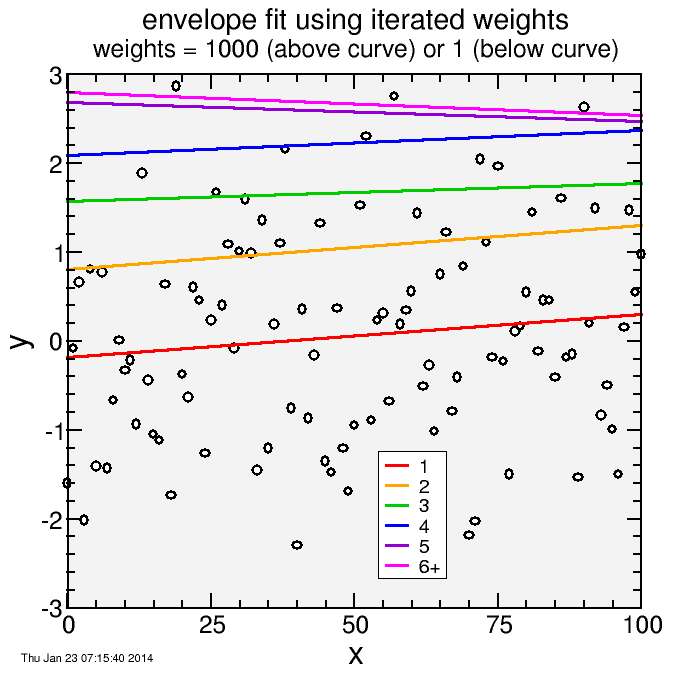
The first fit is the red curve. The weight of all points was set to 1. For this fit, as many points fall above as below the curve. But then based on this fit, the weight of the points above was set to 1000, the weights of the points below kept at 1.
This led to the orange curve. The points below the red curve are now substantially de-emphasized. So the orange curve cuts through the points which were above the red curve.
Now weights were reassigned so those above the orange curve were 1000, all others 1. A new fit led to the green curve. The fitted curve keeps floating upward.
Finally, at the sixth fit, an equilibrium is reached. Here the pull from the 3 points above with weight 1000 is matched by the pull from the 98 points below with weight 1. The curve isn't a formal envelope, as some points still fall above, but it comes close. With a higher weight (for example, 10 thousand) it would come closer to a perfect envelope fit.
This was just exemplary. For the power-duration model, there's more work to do since that's a nonlinear model.


Comments