The Veloclinic power-duration model
Pn = (1 − exp [ −t / τn ] ) ( Wn / t )
where Wn is the capacity of energy source n, and τn is the time constant for the delivery of power from that source. For small times, the formula (1 − exp [ −t / τn ] ) can be approximated t / τn, from which it is clear the maximimum power available from energy source n is thus Wn / τn (the t's cancel).
As a result, the formula can be rewritten:
Pn = (1 − exp [ −t / τn ] ) ( Pmax,n τn / t )
To get total power, power components are then summed:
P = sum over n { Pn }
With this model, if we assume two energy sources, one (n=1) short-term, and the other (n=2) long-term, then τ1 would be short (the short-term power can be delivered quickly) while τ2 would be long (the "aerobic" power source has lots of available capacity but is rate limited over substantial time durations).
Here's a comparison of 2-component models, comparing the critical power model (CP) to a 2-component Veloclinic model:

Obviously the Veloclinic model is a lot more realisitic in that power is capped at small times and continues to drop at very long times. The question is how well this matches actual power data. So to check this I dredged up some old Powertap data from my archives (back when I recorded data using my little yellow computer) where I saved maximal power curves at various points. I plot these curves here, along with a rough fit of a Veloclinic 2-component model. The goal here is to fit the envelope of the curves, not a least-square fit, since a maximal power curve represents the best you can do, not a typical effort generated under random, nonideal conditions.
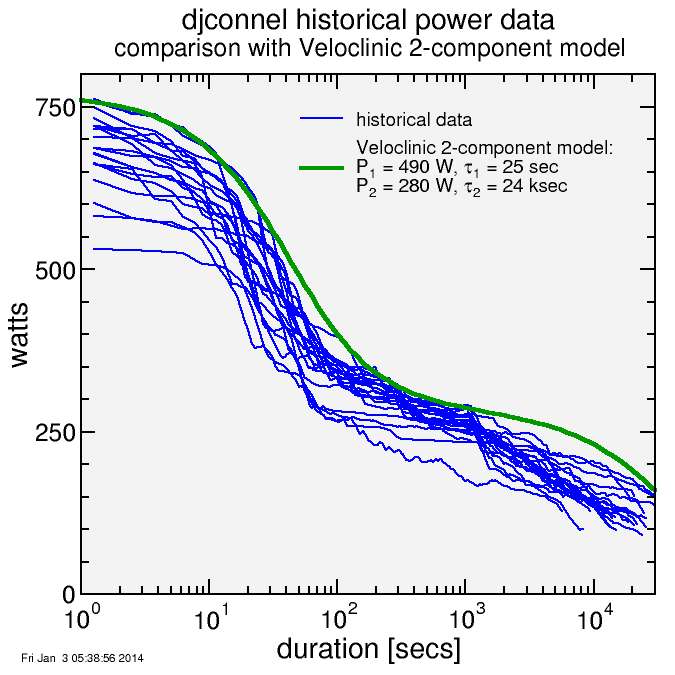
The Veloclinic model does an credible job of reproducing the shape of the curve. The principal point of weakness is in the range above 2000 seconds. This is still a range where quality efforts exist, since long climbs like Mount Diablo take up to close to 4000 seconds, although pacing on these long climbs is more challenging than on shorter ones (if I go out for a 3600 second climb at a pace I could sustain for 5000 seconds, then I'll not get a good 3600 second power). But there's the feeling the "capacity-limited" approach here is too restrictive. To some degree on long efforts capacity is being replenished. But this is just a 2-component model, and a 3-component model could certainly fit this data range better.
Indeed instead of two such energy sources, Veloclinic uses three to fit actual data. More components = more fitting parameters = a better fit, but it's hard to say whether this yields more predictive power. This is because the quality of data is always lacking. Riders don't generate quality efforts at every time interval. Typically you may go out and really rip a short climb, maybe put in a super effort on a longer climb, and then later do a leg-searing sprint. That's 3 quality time points. If you've got more fitting parameters than quality data points then you're going to have a hard time getting meaningful numbers. The CP model has 2 parameters. The Veloclinic 2-component model has 4 parameters. The 3-component model has 6 parameters.
For Golden Cheetah I worked out a fitting procedure for the CP model, which requires 2 parameters. It should be possible to do something similar for the Veloclinic 2-component model. In the CP fit, I found 2 "quality" points, one in the 1-6 minute range, the other in the 6-60 minute range. For the Veloclinic model I'd need 4 "quality points": two additional points. A sprint (for example, 5 second data) would be one. Then an additional point in the 120+ minute range might be useful for the endurance limits. This would give me 4 points, allowing me to fit 4 parameters.
For a 3-component model, I'd need to partition the times between "sprint" and "endurance" with finer resolution. For example: "short anaerobic", "long anaerobic", "short aerobic", "long aerobic", and "endurance". It puts a strain on rider data to assume quality points in each of these time intervals.
If I was going to attempt to "improve" this model I'd perhaps modify it slightly, thus:
Pn = (1 − exp [ −(t / τn)αn ] ) Pmax,n (τn / t)αn.
This form of the model has an additional parameter, αn, per energy component. This could yield 6 fitting parameters for a 2-component model, or 5 fitting parameters if I assume αn = 1 for the anaerobic component. This could yield a more gradual attenuation of the long-term power.
For example, I re-examined the preceding data with a simple choice of α1 = 1 and α2 = 0.5. I was then able to re-adjust the other fitting parameters to better reproduce the behavior at long times:
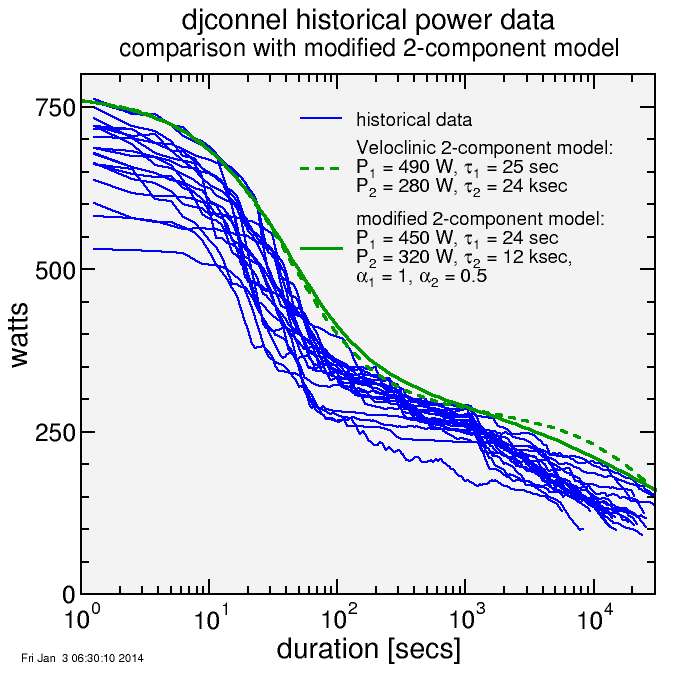
For fitting purposes here the question would be whether there's a need to fit the αn terms or whether the choices of 1 and 0.5 are sufficiently universal. I 'd start with the latter assumption.


Comments