running km per day: more trend analysis
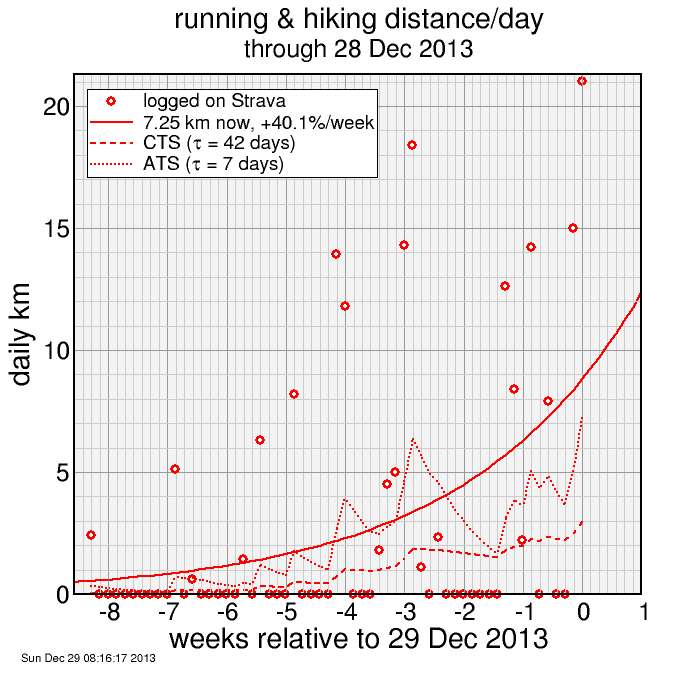
Yesterday I did a run followed by a hilly hike, each approximately 10.5 km. This put a 21 km point on my trend analysis plot. I then redid the plot, including my least-square regression of an exponential curve. Here's the result, along with two other curves I'll explain in a bit:

This was my longest day so far, but it was just one day. However, the result was a profound change in the exponential trend line.
Small aside: in the plot I did yesterday, I made a small error, which was to assume when you fit a curve K exp(α t) to time-series data, if &alpha is in units 1/week, then this represents a 100×&alpha% per week increase. This is a good approximation only for small values of &alpha. I corrected this error in the text of yesterday's blog (not the plot), and did it correctly in this plot.
Anyway, the problem with the exponential trend line is least-square fits are highly influenced by outliers, especially when they occur at the edge of the data. So yesterday's long day had an exceptional influence on the parameters. This suggests the parameters aren't so good.
So I returned to an established analysis mode: CTS and ATS. These are typically applied to data related to the work done during cycling events, but distance and work in running and hiking are strongly correlated, so applying them directly to distance seems suitable here. ATS (acute training stress) running exponential average with time constant 7 days, while CTS (chronic training stress) is a running exponential average with time constant 42 days. The shorter time constant represents fatigue and responds more rapidly to changes in daily distance, the longer time constant represents fitness and responds slower.
I see ATS spiked at San Diego 3 weeks ago. After that I recovered a but, then ATS ramped up, hitting an even higher spike at the point 0 (yesterday). It's now at 7 km/day. CTS, representing fitness, is only at 3 km/day, however. This implies I'm still ramping up mileage, building endurance. Were I to taper for a marathon, for example, I'd want ATS to dip below CTS by race day.

Comments