CP model parameters from maximal power curve: iterative method
Last time I described in principle what I want to do in fitting critical power (CP) model parameters to maximal power data. Recall the idea is to derive a model which envelops the existing data: no data values should fall above the curve, but subject to that restriction, the curve should be as low as possible, touching at least two of the measured data values. The fit to the curve is most easily done using work versus time, rather than power versus time, where for each time duration work equals the product of average power over the interval and the duration of the interval. Typically units used are watts for power and seconds for time. Multiplying these gives work in joules, typically reported in units of 1000 called kilojoules (kJ).
So the first step is to derive the maximal work for each interval. One point which some codes miss is that work done can never decrease with increasing time. Obviously if someone did a certain number of kilojoules in a certain time, even if he got off his bike, for all longer intervals he at least did the same amount of work. So the code needs to check to make sure that an interval shorter than a time being considered may provide the highest work for that time.
Okay, so I have the curve. I then want to make sure I'm fitting a curve through a point with a high fraction of anaerobic work contributing to the power, and another point with a relatively high fraction of aerobic power. This will reduce the possibility of ambiguous results like the one I schematically showed last time, and will reduce the likelihood of wildly anomalous results associated with weakly populated data sets.
So I define two regions of the curve. The first is an anaerobic region in which anaerobic work is a sufficiently large contributer. I want this interval to be long enough that neuromuscular power, which is the primary contributor to large sprints, plays a relatively minor role. But it should not extend into the time range where aerobic power tends to dominate. The range I selected for this was between 1 minute and 6 minutes.
For the aerobic points I want a regime which is relatively inaffected by AWC, more strongly affected by CP. So I start the aerobic regime at 10 minutes. On the upper end there's no fundamental reason to set a limit, but using fewer points to be checked speeds the calculation, and there's not much reason to go beyond an hour. Additionally the contribution of AWC to power for efforts longer than one hour becomes small, anyway, so the potential error from ignoring these longer interval durations is small.
So now I have data extending from 1 minute to 6 minutes in duration for AWC extraction, and other data extending from 10 minutes to 60 minutes for CP extraction. The rest of the data I ignore.
Rather than some super-clever instant solution to the problem, I decided to solve it iteratively: solve for one parameter assuming the other is known, then solve for the other assuming the first is known. Then repeat until the values stop changing more than a small value (for example, I use the convergence criterion that AWC/CP changes by less than 1 µsec).
Actually, rather than solve for AWC and CP, I solve for AWC/CP (which I call τ) and CP. I do this because I figure while CP may vary a lot, perhaps AWC tends to be proportional to CP, so τ will vary less. The time-constant τ describes how "anaerobic" a rider is relative to his aerobic power. A high value of τ (say, more than 90 second) means the rider is "punchy" and has a strong attack, while a small value (say, less than 60 seconds) describes a rider who prefers steadier efforts. I find τ more intuitive than AWC, but either works.
So I start assuming τ = 0 (and therefore AWC = 0). Then I find the time interval which gives the best value of CP. Since AWC = 0, this is simply the point in the aerobic range with the most power, so it is most likely the point at 10 minutes.
Then I take that value of CP, and from the points in the anaerobic time range (1 to 6 minutes) I find the point which gives the best value of τ (also AWC). This could be any point in that range of times: even though points at low times tend to have higher average powers than for long times, they also have a larger time difference from the point used for the aerobic power, and therefore the derived value of AWC or τ may be less than it would for a point of lower power and longer duration within the "anaerobic" time interval.
After solving for both, I then check if τ has changed more than 1 µsec. It probably has, since I started assuming it was zero, so I iterate.
To iterate I now assume the value of τ (AWC/CP) I just calculated and find the point in the aerobic range which maximizes CP. This is equivalent of scaling the curve of work versus duration to touch one the most prominent point in the aerobic range. Here it is far less likely to be the point at 10 minutes: points of higher work and longer duration may be more prominent depending on how large the estimate of AWC/CP.
Then I assume this value of CP and find again the anaerobic point which maximizes τ (or AWC). This is the same as I did the first iteration.
I simply repeat this procedure until from one iteration to the next τ changes by less than 1 µsec, or after 100 iterations in which case I give up. In reality, it typically takes less than 10 iterations to converge.
The following sequence of plots show an example using the "toy" data I presented in the previous post. It shows data only out to 20 minutes, not 60, so assume for purposes of this example maximal work above 20 minutes increases relative slowly and the data don't contribute to the extraction.
First I define anaerobic and aerobic regions:

Then I assume AWC = 0 and solve for CP. This is equivalent to finding the line of maximum slope passing through the origin and a point in the "aerobic" range.

Then I move the curve up as far as I can while still passing through a point in the "anaerbic" region. This y-intercept is now AWC.

Then I multiply the curve by the largest scale factor (less than one) which allows it to still pass through a point in the aerobic region. This is equivalent to keeping a constant AWC/CP. I could just as well have assumed a constant AWC, in which case I would have pivoted the curve about its y-intercept.
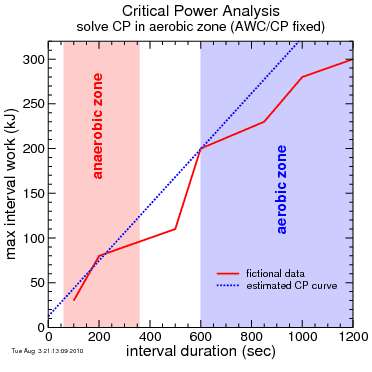
Time for another iteration on AWC: slide the curve up to catch the most prominent point in the anaerobic regime:

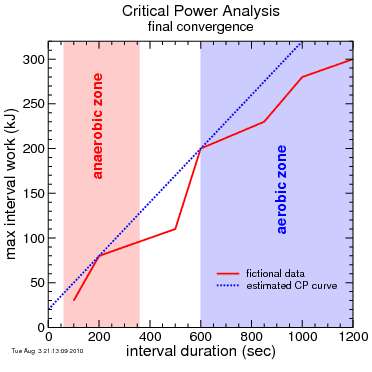
And repeat these steps until the CP curve stops moving significantly:
What's the primary weakness of this process? It's probably those missing points between 6 minutes and 10 minutes. It's possible that points in this range will fall above the critical power curve, proving the critical power curve is the wrong curve. So to correct for this, it would be possible to increase AWC or CP to bring the curve above the points in this range. But which do you increase? That's not clear, so a better solution is for a rider to increase his supply of quality data in the 1-6 minute and/or the 10+ minute range. To try and guess the best way to reconsile the points in the 6 to 10 minute range would potentially give virtually meaningless results. For example, the correction might result in a substantial overestimation of AWC with a compensating underestimation of CP.
The other issue is the rider needs to have at least one quality point in each of the two ranges: the anaerobic range from 1 to 6 minutes, and the aerobic range from 10 minutes to an hour. If there all you do are 20 minute climbs, then you're going to overestimate your CP and underestimate your AWC. On the other hand if all you do are 5 minute intervals, you'll overestimate AWC and underestimate CP. This leads to the counterintuitive result that you absolutely nail a 5 minute effort and CP drops. Since CP is used in Goldencheetah to derive power zones, the result may the power for each zone decreases similar to what you would expect with detraining. I believe this is part of the reason Andrew Coggan doesn't recommend using a derived CP value for power zone determination: he prefers 1 hour power, or 20 minute power. But in Golden Cheetah the CP value derived from the maximal power curve is not automatically used for power zone determination: the user has to request that it be used.
So the method is far from perfect, but no method is perfect. I think it provides the real advantage that one can still use those race-like efforts to contribute to CP extraction, even if they don't have efforts perfectly aligned with arbitrary values used in some CP-extraction spreadsheet.
So the first step is to derive the maximal work for each interval. One point which some codes miss is that work done can never decrease with increasing time. Obviously if someone did a certain number of kilojoules in a certain time, even if he got off his bike, for all longer intervals he at least did the same amount of work. So the code needs to check to make sure that an interval shorter than a time being considered may provide the highest work for that time.
Okay, so I have the curve. I then want to make sure I'm fitting a curve through a point with a high fraction of anaerobic work contributing to the power, and another point with a relatively high fraction of aerobic power. This will reduce the possibility of ambiguous results like the one I schematically showed last time, and will reduce the likelihood of wildly anomalous results associated with weakly populated data sets.
So I define two regions of the curve. The first is an anaerobic region in which anaerobic work is a sufficiently large contributer. I want this interval to be long enough that neuromuscular power, which is the primary contributor to large sprints, plays a relatively minor role. But it should not extend into the time range where aerobic power tends to dominate. The range I selected for this was between 1 minute and 6 minutes.
For the aerobic points I want a regime which is relatively inaffected by AWC, more strongly affected by CP. So I start the aerobic regime at 10 minutes. On the upper end there's no fundamental reason to set a limit, but using fewer points to be checked speeds the calculation, and there's not much reason to go beyond an hour. Additionally the contribution of AWC to power for efforts longer than one hour becomes small, anyway, so the potential error from ignoring these longer interval durations is small.
So now I have data extending from 1 minute to 6 minutes in duration for AWC extraction, and other data extending from 10 minutes to 60 minutes for CP extraction. The rest of the data I ignore.
Rather than some super-clever instant solution to the problem, I decided to solve it iteratively: solve for one parameter assuming the other is known, then solve for the other assuming the first is known. Then repeat until the values stop changing more than a small value (for example, I use the convergence criterion that AWC/CP changes by less than 1 µsec).
Actually, rather than solve for AWC and CP, I solve for AWC/CP (which I call τ) and CP. I do this because I figure while CP may vary a lot, perhaps AWC tends to be proportional to CP, so τ will vary less. The time-constant τ describes how "anaerobic" a rider is relative to his aerobic power. A high value of τ (say, more than 90 second) means the rider is "punchy" and has a strong attack, while a small value (say, less than 60 seconds) describes a rider who prefers steadier efforts. I find τ more intuitive than AWC, but either works.
So I start assuming τ = 0 (and therefore AWC = 0). Then I find the time interval which gives the best value of CP. Since AWC = 0, this is simply the point in the aerobic range with the most power, so it is most likely the point at 10 minutes.
Then I take that value of CP, and from the points in the anaerobic time range (1 to 6 minutes) I find the point which gives the best value of τ (also AWC). This could be any point in that range of times: even though points at low times tend to have higher average powers than for long times, they also have a larger time difference from the point used for the aerobic power, and therefore the derived value of AWC or τ may be less than it would for a point of lower power and longer duration within the "anaerobic" time interval.
After solving for both, I then check if τ has changed more than 1 µsec. It probably has, since I started assuming it was zero, so I iterate.
To iterate I now assume the value of τ (AWC/CP) I just calculated and find the point in the aerobic range which maximizes CP. This is equivalent of scaling the curve of work versus duration to touch one the most prominent point in the aerobic range. Here it is far less likely to be the point at 10 minutes: points of higher work and longer duration may be more prominent depending on how large the estimate of AWC/CP.
Then I assume this value of CP and find again the anaerobic point which maximizes τ (or AWC). This is the same as I did the first iteration.
I simply repeat this procedure until from one iteration to the next τ changes by less than 1 µsec, or after 100 iterations in which case I give up. In reality, it typically takes less than 10 iterations to converge.
The following sequence of plots show an example using the "toy" data I presented in the previous post. It shows data only out to 20 minutes, not 60, so assume for purposes of this example maximal work above 20 minutes increases relative slowly and the data don't contribute to the extraction.
First I define anaerobic and aerobic regions:
Then I assume AWC = 0 and solve for CP. This is equivalent to finding the line of maximum slope passing through the origin and a point in the "aerobic" range.
Then I move the curve up as far as I can while still passing through a point in the "anaerbic" region. This y-intercept is now AWC.
Then I multiply the curve by the largest scale factor (less than one) which allows it to still pass through a point in the aerobic region. This is equivalent to keeping a constant AWC/CP. I could just as well have assumed a constant AWC, in which case I would have pivoted the curve about its y-intercept.
Time for another iteration on AWC: slide the curve up to catch the most prominent point in the anaerobic regime:
And repeat these steps until the CP curve stops moving significantly:
What's the primary weakness of this process? It's probably those missing points between 6 minutes and 10 minutes. It's possible that points in this range will fall above the critical power curve, proving the critical power curve is the wrong curve. So to correct for this, it would be possible to increase AWC or CP to bring the curve above the points in this range. But which do you increase? That's not clear, so a better solution is for a rider to increase his supply of quality data in the 1-6 minute and/or the 10+ minute range. To try and guess the best way to reconsile the points in the 6 to 10 minute range would potentially give virtually meaningless results. For example, the correction might result in a substantial overestimation of AWC with a compensating underestimation of CP.
The other issue is the rider needs to have at least one quality point in each of the two ranges: the anaerobic range from 1 to 6 minutes, and the aerobic range from 10 minutes to an hour. If there all you do are 20 minute climbs, then you're going to overestimate your CP and underestimate your AWC. On the other hand if all you do are 5 minute intervals, you'll overestimate AWC and underestimate CP. This leads to the counterintuitive result that you absolutely nail a 5 minute effort and CP drops. Since CP is used in Goldencheetah to derive power zones, the result may the power for each zone decreases similar to what you would expect with detraining. I believe this is part of the reason Andrew Coggan doesn't recommend using a derived CP value for power zone determination: he prefers 1 hour power, or 20 minute power. But in Golden Cheetah the CP value derived from the maximal power curve is not automatically used for power zone determination: the user has to request that it be used.
So the method is far from perfect, but no method is perfect. I think it provides the real advantage that one can still use those race-like efforts to contribute to CP extraction, even if they don't have efforts perfectly aligned with arbitrary values used in some CP-extraction spreadsheet.


Comments