running power vs speed in Péronnet and Thibault
Yesterday I was reading Péronnet and Thibault, Mathematical analysis of running performance and world running records, Modeling Methodology Forum 1989. This article describes a power-duration model applied to running world records. But running world records are recorded in distance and time, not power, so to apply their model they need a power-speed model for running.
Their power-duration model has issues, in my view. For one it's not analytic (it contains a slope discontinuity). But for another, as written it contains an integral, trivially enough solved analytically, but presenting needless complexity as written. But this is a digression: the purpose of this pose is their power-speed model.
They use the following, which they attribute to Di Prampero, Riv. Cult. Sportiva 3: 3-7, 1984. It's similar to the bicycle power-speed model: nothing exciting here.
Pv = BMR + 3.86 v+ 0.4 BSA v3/BM + 2 v3/D
The first term, BMR, is basal metabolic rate. So it's immediately obvious here here we're dealing with metabolic work, not mechanical work. In cycling, we don't assign power for sitting and breathing.
This is consistent with the much later work of Minetti, which I examined here.
The next term, 3.86 v, is an analog of "rolling resistance" in cycling. Minetti, measuring carbon dioxide exhalation on a treadmill, fit a polynomial to values measured versus slope and got values of 3.6 kJ/kg/km for the same coefficient for running, 2.5 kJ/kg/km for walking, although the minimum values measured specifically at zero slope were a bit lower on average: 3.40 kJ/kg/km for running, 1.64 kJ/kg/km for walking. Note there exists a walking speed of maximal energy efficiency, approximately 1.0 m/sec, but for running he claims the energy cost for mass per distance was relatively speed-independent. Minetti's treadmill experiment obviously didn't include wind resistance or acceleration energy.
I described a running power-speed model for flat ground in this post, where I looked at the power required to bounce the center-of-mass up and down, and the power required to accelerate the legs forward with every kick.
Anyway, I digress. The second term is an energy cost per unit distance per unit mass for running, which to decent approximation is constant.
The next term is a wind resistance term. This is the problem. The energy cost per unit distance from wind resistance is generally approximated:
To go from this to a power you need to convert distance to time, which is a factor of velocity, and then normalize by body mass I get:
ρ is the density of air and is typically around 1.2 kg/m3.
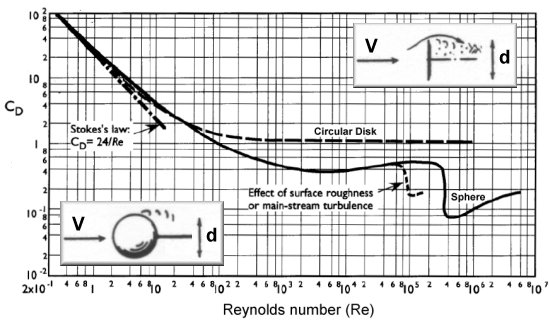
CD is a coefficient of drag and is typically around 1. Here's an example of a sphere from Aerospace Web, plotted versus Reynolds number, which is related to speed:
This plot makes it clear that as speed increases, coefficient of drag drops a bit, at least until turbulence takes over and it increases dramatically. Runners are generally slower than cyclists so it makes sense the CD for runners would be a bit lower. Additional contributors to this would be the angle of the body with respect to the wind cycling versus running.
A is the cross-sectional area. That's hard to measure, generally, but Péronnet and Thibault assume around 1.8 m2 for males, 1.6 m2 for females. This I find surprising. 1.8 meters seems like a respectable height (I'm 1.69 meters). But this assumes an effective width of a full meter. My shoulders are only 38 cm center-to-center, so assuming even 50 cm for the width of the body, averaged over its full height including the head, seems even a stretch in my case. The error's even greater if you consider on average runners aren't upright, facing the wind, but rather slightly leaned and/or crouched with at least one leg at a substantial angle relative to the ground. Sure, there's additional wind resistance kicking legs back and forth, but even so, 1.8 meters seems like a stretch. In the past I've used 0.75 meters squared for someone my size. So I'll say for a 1.8 meter runner, 0.90 meters squared seems a reasonable upper-bound estimate, using 0.5 meters as a typical width of the human body. All I can think is perhaps they assumed the full surface area of the human body, front and back and sides, rather than frontal area.
M is body mass. For this they assume 70 kg for males and 50 kg for women. This seems rather arbitrary.
So if I multiply ½ ρ CD I get around 0.6 kg/m3. Then I multiply by my 0.9 meter-squared area and I get 0.54 kg/m. Using the numbers reported in Péronnet and Thibault, with the larger area but a smaller coefficient, I get 0.72. This is 33% higher.
But wait! They're modeling metabolic energy, not mechanical work, and metabolic efficiency isn't much higher than 25%. So if I consider this, their estimate goes from 33% higher (4/3) to around 1/3 of my estimate. It's clear they're substantially underestimating the energy cost of wind resistance. I strongly suspect they simply forgot the metabolic efficiency term in their calculation.
The next term is an acceleration energy. Runners start at rest, then accelerate to speed. For a sprint this is a big component of the energy cost, while for a marathon it's trivial. But their coefficient here is 2, not the usual ½. Why?
There's two explanations. One is they tossed in a factor of 4 for metabolic efficiency. But another might be they assume constant acceleration through the event. If you assume constant acceleration then the acceleration is to a peak velocity which is twice the average velocity and so, accounting for the v2 dependence of energy on final speed (there's another v term from converting from time to distance, and that's clearly average velocity) they get an additional factor of 4.
But obviously runners don't instantly accelerate up to an average velocity. To some degree accounting for the acceleration phase is important. But even for a 100 meter dash runners don't uniformly accelerate over the whole distance.
Without contaminating my judgement with actual data, I'd assume a decent approximation for speed in a sprint is probably an exponential curve:
The exponential will approach zero quickly when tf >> τ, so if I assume the runner had plenty of time to reach terminal speed, which should be the case for even the 100 meter dash, then I can approximate this:
Science of Sport analyze Bolt's 100 meters in Beijing in 2008. Here's their plot:
So much for theory: Bolt indeed slows down before the finish. His final velocity is actually quite close to his average velocity. So assuming a terminal velocity equal to the average velocity is likely a good approximation, at least for the shortest distances where it matters the most. Note his peak velocity is higher, but accelerating to the peak velocity is energy storage: he gets some of that investment back later in the race due to inertia.
So the factor of 2 used by Péronnet and Thibault may be a fortuitous error, or an implicit assumption of 25% metabolic efficiency. Either way the acceleration energy term seems to be fairly good.
I'm not so interested in metabolic energy as I am in mechanical work, since my background is cycling, not running. Given this, it will be interesting to see how my power-duration model, inspired by cycling data, matches up to present-day world-record numbers.
½ ρ CD A v2
½ ρ CD A v3 / M.
v = [ 1 - exp(-t / τ) ] vf,
where vf is the final (asymptotic) speed, and τ is a time constant representing how quickly that speed is approached. To get the average speed, I integrate this and divide by duration:
|v| = (1 - [τ / tf] [1 - exp(-tf / τ)]) vf.
|v| ≈ (1 - [τ / tf]) vf.


Comments