Low-Key week-to-week score variance
I had some questions about the Low-Key scores from a rider who didn't understand why he scored better in one week than in another. I can't answer that question, but I decided to look again to see if I could see any bias in the results. For example, did strong riders tend to score better in one week versus the other, which would unfairly advantage strong riders who had done well in the higher-scoring than the lower-scoring week?
The way I like to check this is by plotting scores one week versus the other. This isn't rigorous statistical analysis, more what Flannery and Press call "chi by eye": check to see if trends are evident to visual inspection.
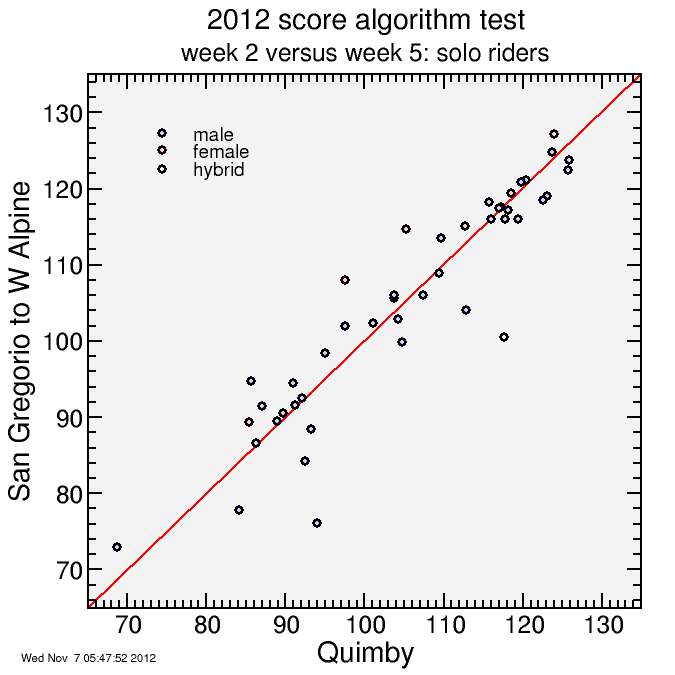
Week 2 was a mass start up the steepest climb so far: Quimby Road. Weeks 4 and 5 were individual starts on roads which included both relatively flat portions and significant, but not particularly steep climbs.
First I compare Quimby (week 2) versus Boulder Creek to Saratoga Gap (week 4). These were highly dissimilar climbs so I might expect some sort of systematic difference:
And here's Boulder Creek to Saratoga Gap compared with the following week, San Gregorio to West Alpine Road. These were similar weeks so I might expect systematic differences to be absent here:
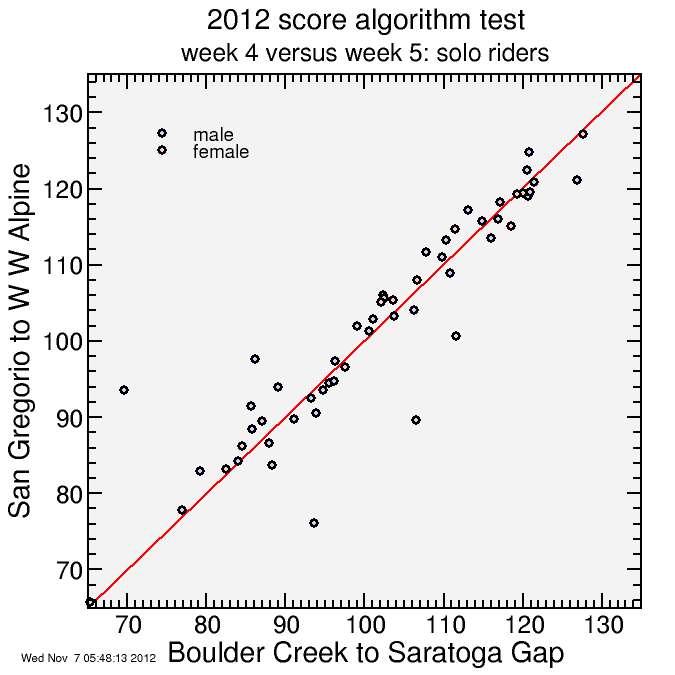
However, I see no systematic biases. The scoring seems to do as designed: a "cloud" of points around x = y. Stronger riders tend to do better than less-strong riders, and each rider sometimes does a bit better or worse, but in any given score range the number of riders doing better in the former week is approximately matched by the number doing better in the latter.
I then did a quantitative check: what was the root-mean-squared (RMS) difference between scores of riders who did any given pair of weeks? If I compare the difference of scores of riders in weeks 1 and 2, and I square each differences, take an average, then take the square root of the average, that provides some measure of how much each climb tends to favor a unique sub-set of riders. For example, if climb x favors riders A, while climb y favors riders B, then you might expect the RMS difference in scores for these climbs would be greater than for climbs x and z which are more similar. Here's the result:
climbs:
w1: Montebello
w2: Quimby Road (Murillo start)
w3: Morgan Territory Road (S)
w4: Hwy 9 from Boulder Creek
w5: Hwy 84 - West Alpine

-----------------------------------
rms score delta (riders doing each)
-----------------------------------
       w1    w2    w3    w4    w5
w1      .  4.54  2.83  5.03  5.78   w1
w2   4.54     .  4.77  7.69  5.47   w2
w3   2.83  4.77     .  3.88  6.18   w3
w4   5.03  7.69  3.88     .  5.47   w4
w5   5.78  5.47  6.18  5.47     .   w5
       w1    w2    w3    w4    w5
The net average is 5.318.
The biggest differences were between weeks 2 and 4 (7.69) and between weeks 3 and 5 (6.18 points). The smallest differences were between weeks 1 and 3 (2.83 points) and 3 and 4 (3.88 points). Curiously weeks 4 and 5 weren't particularly similar (5.47 points). It's normal this RMS difference would bounce around a bit from one pair of weeks to the other, due just to random variation. I don't see any profound patterns here.
An interesting aspect of this analysis is it gives some indication of how much one can hope to change ones score week-to-week. For example, a rider scoring 100 points in a given week might well hope to boost that to 105 points in a following week, but boosting it to 110 points would exceptional unless the first week was a particularly off week.


Comments