Low-Key Hillclimb ITT passing data
Low-Key 2012 week 4, the time trial from Boulder Creek to Saratoga Gap, was an amazing success. For all the concerns expressed about passing, concerns I did my best to dispel, it simply wasn't a problem. Many of us were left scratching our heads over why people were so worried.
I posted a simulation of the passing simulation here. This was based on certain simplifying assumptions:
- Riders left at uniform one-minute intervals. This turned out to not be the case, as starters allowed late-comers to start on 30-second intervals. Of course, these late-starters left a 1:30 gap ahead of them, partially mitigating the effect of the now 30-second gap behind them. Additionally, many riders failed to show up, leaving gaps in the start sequence.
- Riders were ranked based on a previous result. This assumption neglected that for some riders it was their first event. For these riders, placement was somewhat arbitrary. Secondly, volunteers who rode were started at times which allowed them to perform their volunteer duties (either early or late) rather than based only on projected speed.
Gaps in the schedule reduce passing proportional to the fraction who fail to show, assuming DNS rate is independent of start position. This wasn't quite the case, with the highest DNS rate apparent in riders with a relatively later start time yet not the latest start times, as the latest starters were the fastest and they tend to be more likely to show up. However, in any case gaps are going to reduce the passing rate.
The other effects will increase the passing rate, however, so it might be anticipated the projection was somewhat optimistic.
Here's the result, omitting the early starting tandems who simply pulled away from the earliest solo riders. The smooth curve was the result of 100 thousand simulations, averaged, while the discrete points are actual results.
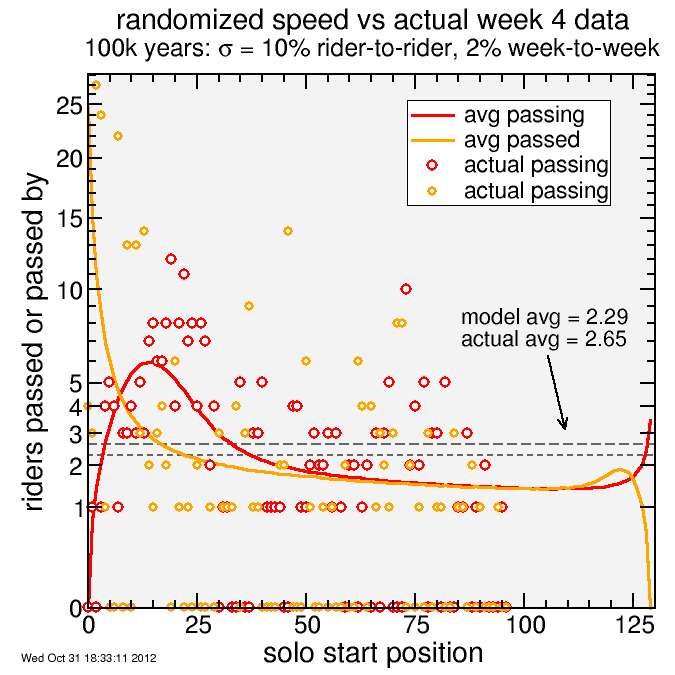
You can see there's fewer riders in the actual data because of the DNS rate. The position shown is position in the actual start order, not scheduled start order But if you look at the shape of the data, it follows the trend of the prediction quite nicely. The earliest starters tend to get passed more often, then the following starters have a relatively large number of passings, then it flattens out until the final starters are more likely to pass than be passed.
The average turned out somewhat higher than predicted, by 16%. The simulation predicted the rider passed the most would be passed 24.6 times, while in reality a rider was passed 27 times. Recall, though, the prediction was an average over 100 thousand simulations. I haven't checked, but I think it's safe to say these results are consistent with the scatter in the individual simulation results. The non-ideal effects I describe appear to have mostly canceled: the no-shows compensated for the imperfect seeding and the occasional 30-second gaps. The simulation served its purpose nicely.
I expect more passings at this weekend's Highway 84 - West Alpine individual time trial. But with wider shoulders on the early part, and steep grades on the later part, passing should be much less of a concern, even if it was a concern on Highway 9.


Comments
"Passed" = number who passed the rider in the given position.
"Passing" = number the rider in the given position passed.
These legends are correct for lines. The symbols correspond to the lines of the same color.