Tour de France 2014: total km versus historical trend
Back in 2010 I did a regression of the Tour de France total length since WWII. There was a clear overall trend of course length reduction. In the 1920's, a typical route was 5500 km. By the 2000's that had decreased by 2000 km. The effect of this was profound: the Tour went from an ultra-endurance event with stages starting hours before dawn, unable to sustain body mass, to one where riders are able to devote considerably more time to recovery each day.
Since then I like keeping tabs on the distance to see how it's doing relative to that trend. After all, while most of the public focuses on the final 20 km of each stage, it's the up to 200 km preceding that which provide the real character of the event, wearing down riders and teams and tapping into the human body's endurance limits. Without those preceding kilometers, the Tour loses some of its character. Even with the pack still together, it's what I call the "unseen attrition" of the effort. It wears riders down. Only those able to survive it are in a position to sprint for the win. The Tour is a self-selecting group. If the stages were half the distance, the final 20 km might seem much the same, but it would be a different group, or at least the riders in that group would have a different physiological optimization. It would lose a good part of it's epic nature which makes it so attractive.
When CyclingNews published data for the 2014 route, I had another datum. Here's the plot:
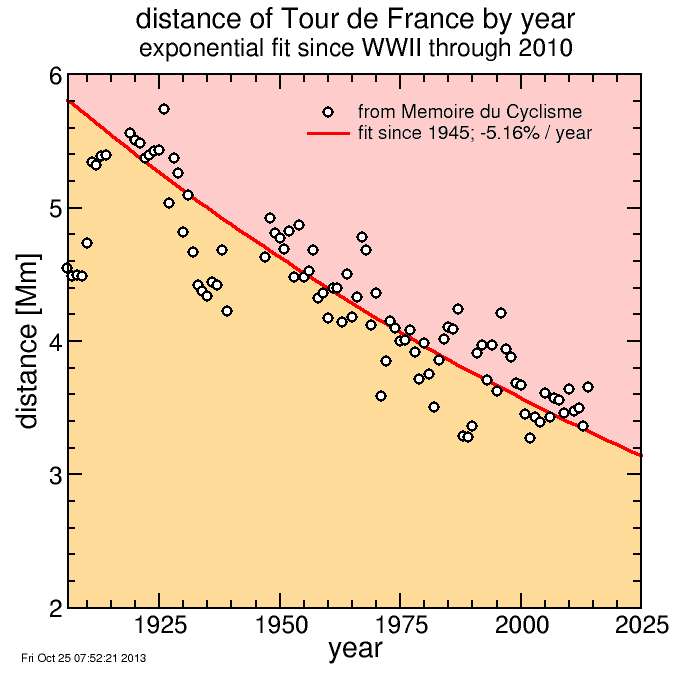
2014's tour distance of 3656 is a strong showing by recent standards: the longest since 2000. But every year 1996-2000 was longer, as was every year 1991-1994. There was a palpable reduction in distance around 2000. But since that drop there has been a plateau. After a relatively short 2013 course, the shortest since 2002, 2014 supports that the present plateau is being upheld. The new distance standard established around 2000-2001 shows no signs of being further diminished. The following highlights the present millenium and the last year of the prior:
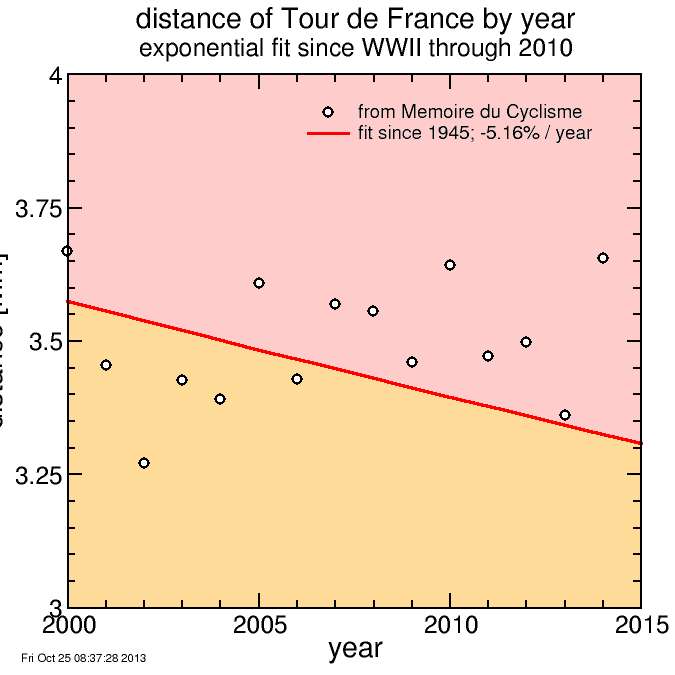
Every year since 2006 has been above the trend line, although last year came close.
But before the traditionalists get excited that we've seen a boost in stage length, the reason for the change is more the type of stages than their length. First, there's no prologue, and prologues are traditionally extremely short, for example 10 km. Second, there's only a single individual time trial, and it's relatively (by today's standard) long at 54 km (a throwback to a time trial in the 1994 Tour, which is coincidently the one and only year I attended). And third, there's no team time trial, and while there have been some epic-distance team time trials in Tour history, in the last decades the rare team time trial has been short so as to minimize the impact on general classification. The road stages themselves are still short by traditional standards. The average of the first 19 stages is 182 km, with a standard deviation of 30 km. Stage 19 is only 125 km, which 20 years ago was a virtually unthinkable sum, except for a split stage. The day after is another mini-stage at 145 km.
Still, the traditionalist in me is happy to see this sort of total km number. I should seriously think about heading over. Carcassonne, perhaps? I was there in 1994.


Comments