testing Portola Valley Low-Key Hillclimb: segment distance consistency
To further test the Low-Key timing on the Portola Valley route, continuing the work of the previous two blog posts, I decided to check the distance covered by 4 riders who completed the course on trial runs. The following is a summary of these results:
The distances shown in the plot are to the checkpoint in question. So for example for checkpoint 2, that's the distance covered from checkpoint 1 to that point. The distance is determined by interpolating ride crossings.
Two numbers are shown: the average distance covered and the standard deviation. The standard deviation represents the spread in the data. Two measurements selected at random are expected to differ by approximately one standard deviation.
There's several sources which could contribute to differences in ride distance for one rider to the next. One is obviously differences in ride distance. Riders didn't always take the optimal route, especially on transfer segments which were nominally untimed, intentionally (for example to stop for water) or unintentionally. Additionally sometimes riders took the inside line versus outside line on steep corners. Additionally it may be a different distance to different points along the start and finish "lines".
But another source is error. For example, GPS glitches may result in the recorded trajectory deviating from the actual trajectory. Then there's the finite sampling rate. A rider riding through a corner follows a curved path, while GPS samples taken at intervals, for example every 3 seconds for a phone but maybe every 8 seconds for Garmin's "smart sampling", will approximate that curved path by a shorter straight-line path.
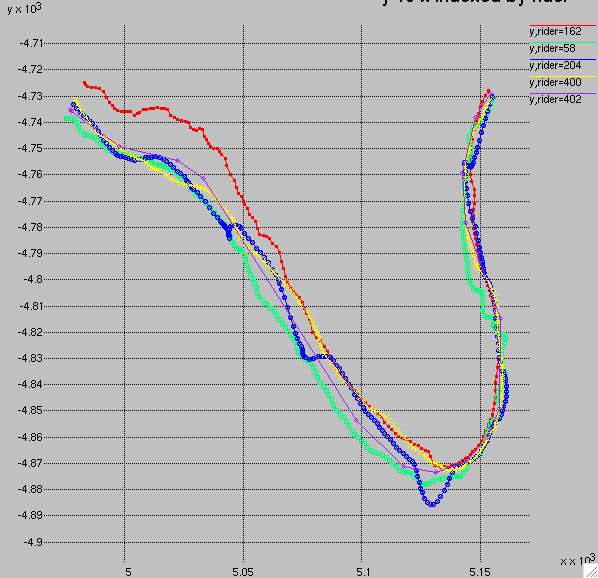
On some cases, the standard deviation is very small. For example, the sections on Golden Oak are amazingly tight, with standard deviation of less than 3 meters. The other checkpoints tend to have more variation. For example, the first half of Summit Spring has 21 meters of variation. Part of this is riders choosing different lines, but the difference is too large for just that to be the case. The GPS signal likely isn't as good on Summit Spring, and the road there has a more convoluted path, which makes it more prone to position errors becoming distance errors.
Here's a comparison between two segments. The first is the upper portion of Golden Oak E, where there is a very tight spread on distance. The second is the upper portion of Summit Spring, where there is a much larger spread in distance. Golden Oak on the top is 20 meters per line on the y-axis, 50 meters on the x-axis. The bottom plot, Summit Spring, is also 50 meters per line on the x-axis, but 10 meters per line on the y-axis.
Note these plots have somewhat compressed x-axes due to an earlier error in my script.


What's the signifance of this? The distance differences don't directly translate into timing errors. However, they are suggestive of larger position errors, and position errors will yield timing errors. For example, on a steep finish of Summit Spring the average speed among these strong riders was 1.8 meters per second. So a 10 meter GPS position error could yield a 6 second difference in time out of an average on that segment of 218 seconds.
That's just how it goes with GPS timing... sometimes you need to get lucky.

Comments