Power comparison: Vector vs Powertap vs Quarq
DC Rainmaker has posted another dataset to his blog (Zip file here). His early installation issues behind him, these data serve as a valuable comparison between the power meters he's using: the spanking new Garmin Vector, the Quarq Elsa, Powertap, and Stages.
The point of this post is to quantitatively compare the powers. But first some discussion...
Each of these power meters is measuring power at a different point in the transmission path. Vector gets first shot at it, picking up power transmitted through the pedal axle. Stages is next, measuring power in the left crank arm. Next, Quarq measures it in the crank spider. Finally Powertap picks up the power which manages to make it to the rear hub. The largest losses are expected between the Quarq and hub, as mechanical losses in the chain and in the rear derailleur pulleys converts mechanical power into heat before the Powertap sees it.
Between the Vector and the Quarq, it takes more imagination. Brim Brothers, not yet available, will measure power in the cleat, and between the cleat and the pedal axle are the pedal bearings, so you'd expect some loss there. But between the pedal spindle and the spider is a hard mechanical linkage. Sure, there's some flex, and any flex-unflex cycles will yield some energy loss (but also some energy storage and release), but cranks are fairly beefy things these days so you'd expect these losses to be in the sub-watt range. In contrast, losses in the drivetrain are on order 3% of total power. FrictionFacts has generates most excellent data on these losses (I recommend their reports).
So it's a mistake to just expect each of these power meters to agree with each other, at least ideally. Of course if I make a pedal-based power meter and calibrate it to a Powertap, it will tend to agree with the Powertap, even though there's power loss between the two detection points. But this would be because I'm making an error in my calibration. Vector, I strongly suspect, doesn't calibrate to a Powertap. On the other hand, it would be easy for them to calibrate to a spider-based system, for example a Quarq or SRM (for example, the Science version). Whatever they choose, it's almost certainly downstream of the axle, so I wouldn't expect losses at the axle-crankarm interface to be included in the Vector power, even if in theory it should capture those. So I'd lump the power meters into two groups: upstream of the chain, and downstream of the chain, Powertap the only one in the latter group.
If I accept that there is some small difference between the power available to each meter, then it would be a mistake to assume they should measure the same value. However, if I assume the transmission losses are roughly proportional to the transmitted power (not a good assumption, actually, since fractional losses depend on gear selection, cadence, and chain tension), I'd expect the meters to track each other if they're all "correct".
To prepare the data, I convolved them with my biexponential smoothing function where each exponential had a characteristic time decay of 10 seconds. This means that variation quicker than 10 seconds wasn't considered. This is to smooth out some of the "noise". This is especially important because power naturally oscillates with each half-pedal-stroke: it's not constant. But we're more interested in the trend, not these half-stroke oscillations. Smoothing the data out to 10 seconds gets rid of some of the artifacts associated with a non-integer number of half-pedal-strokes fitting into teach one-second time sample. This is especially important for the Powertap.
I then made sure the powers were synchronized. Actually, cadence was convenient for this. The only change I made was to delay the Quarq data by 2 seconds relative to the other. Then I eliminated missing data points. Each data stream had a few missing points. I can't take a difference if either of two data streams being compared are missing.
Then I substracted the powers from one meter versus the other. This is an absolute power difference. I could have done a fractional power difference, in which case I'd take the natural logarithm of the powers first, but since I care less about small powers than large powers, I used an absolute difference.
Then I stripped out the first and last 60 seconds of data. This was to give the smoothing, which uses data to both sides of a given point, something to work with.
Note two things can yield a difference in power. One is an actual difference in the power measurement for a given applied power. But the other is a difference in the time delay, if power is time-variable, as it always is with a human pedaling the bike. So even a human pedaling a bike absolutely the same with the same power meter two different times, there will be power differences. This is because the one-second samples will have different registrations within the data set. For example, if the power is increasing 100 watts/second, one attempt may result in samples spanning 250 to 350, then 350 to 450 watts, while the next iteration might have samples spanning 300 to 400, then 400 to 500 watts. When I do my comparison, I'll get a 50 watt difference, even those these were equivalent trials with equivalent measurement systems.
So here are the results. In each case I plotted the histogram on a logarithmic axis, so the spread is actually a lot tighter than the plot might appear at first. I also fitted a normal distribution curve, which is characterized by a mean and a standard deviation (σ). The σ characterizes the spread in the data:


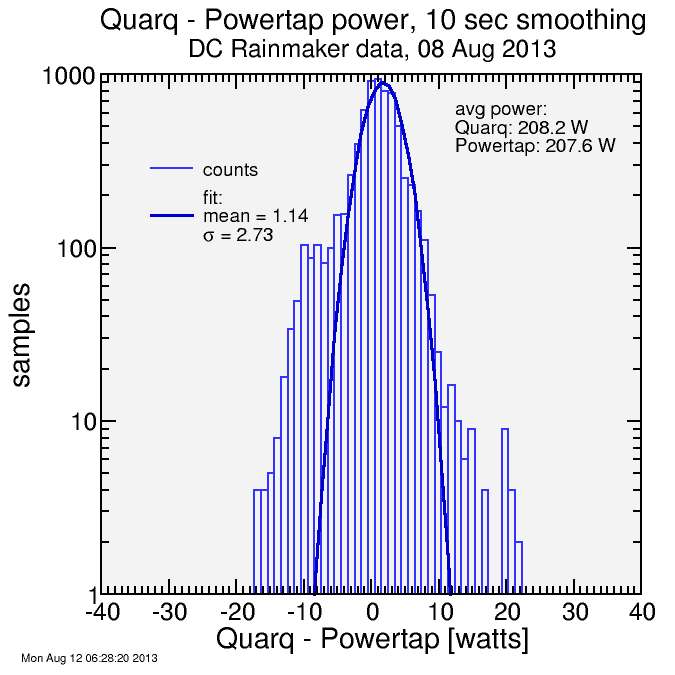
The "winner" for the best agreement is between Quarq and Powertap. However, the difference between Vector and Powertap is a lot closer to the 3% or so you'd expect from drivetrain losses. So the difference between Vector and Powertap is more in line with theory than the difference between Quarq and Powertap. The spread of the difference between Quarq and Powertap is tighter than the spread in the comparisons involving Vector.
However, the three results are quite close, around 3 watts, which is on order 1.5% of the mean power. Given some of this is from transients in power, as I described earlier, as opposed to power measurement error, these comparisons are in my view spectacularly good. I'd be more than happy using any of these three power meters based exclusively on these results. I feel slightly compelled toward the Vector or Powertap versus the Quarq since the power difference between those two is what I'd expect from theory, but it's very close.
That leaves the Stages, which I'll look at next.
correction:: Because of the way XmGrace encodes histogram data, I had a 0.5 watt bias in my Gaussian fits to the histograms (they're shifted to the right 0.5 watts). I fixed the numbers in the legends.


Comments
1. I wonder what happens if you torque one pedal to 32 Nm and the other to 40 Nm (or any other unequal torque).
2. I wish Ray (and the Bikeradar team) had reported how much torque they'd applied to each pedal after re-installation.
3. If I had Vectors, I don't think I'd want to use a Park Tools HCW-16.
On the second time, they were both tightened to 25ftlbs (33Nm). I actually have a photo of it, but it's a bit blurry since it was taken indoors - so I didn't include it.*
I wouldn't want to speak on behalf of the BikeRadar guys, but I could see a scenario where they may have also been in the same spot. There was only one 'legit' pedal wrench there that I saw, and then the little tiny silver one you saw in the pics.
*The 'clearest' of the three pics: https://sites.google.com/site/dcrainmakerblog/Home/IMG_0591.JPG