Raceweight: looking at rider mass data leading to San Bruno Hillclimb
Approaching the San Bruno Hillclimb this year, two riders I know decided they needed to reach race weight. They weighed themselves daily, publishing the results via Twitter. I found the data interesting, so decided to do some analysis.
Here's a plot of their recorded mass in kg versus the day, where I've designated "race day", 01 Jan 2013, as "zero". Rider C began his calorie restriction earlier then Rider B, who began soon after Thanksgiving holiday. Here's the data:
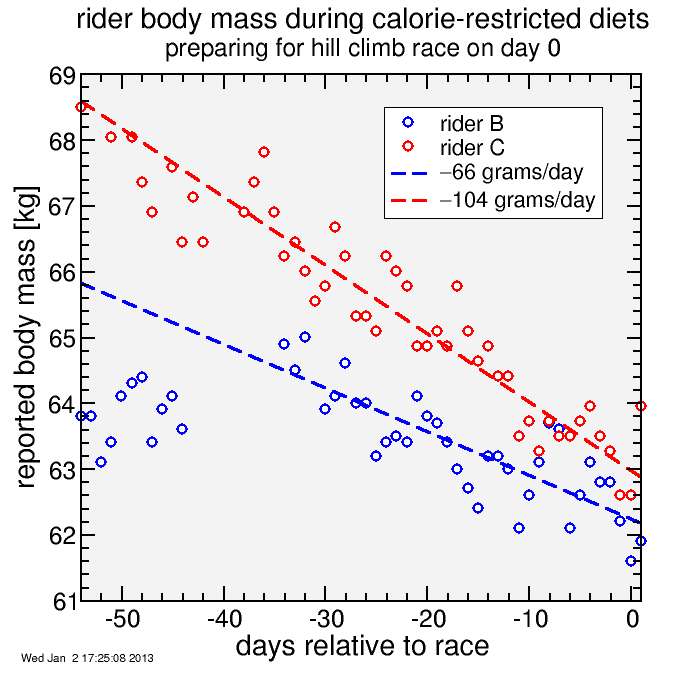
I did a linear regression of their progress for the final 35 days (-34 to 0, inclusive). This includes all of Rider B's data up to and including race day, but excludes the day following. It excludes an upward blip in mass Rider C experienced during the Thanksgiving holiday (likely glycogen & water, I suspect). You can see the data generally follow the linear trend: both riders were exemplary in sticking to their diets. Rider B lost mass at approximately 66 grams / day, which is an impressive 1.02 lb / week of weight loss, but Rider C was losing an incredible 104 grams / day, which is 1.60 lb / week of weight loss. I've never lost weight this quickly.
The key thing to notice, however, is the large variation about the trend. To investigate this, I plot the residuals (actual mass minus the linear fit) for each rider during the period from 34 days prior race day to race day. Here's that result:

There is a lot of day-to-day scatter in mass relative to the trend. I calculated the statistical standard deviation of these residuals, and got 462 grams for Rider B and 430 grams for Rider C. For those mired in imperial units, this is an average of 0.98 lb one-sigma variation in body weight relative to the trends. For two randomly selected measurements the RMS difference is sqrt(2) sigma, which in this case is 640 grams. That's huge: around 1% the mass of these riders.
Body weight is by definition what the body weighs. However, in tracking it one is generally interested in changes in structural components: fat, muscle, bones, skin. Other components include water, glycogen, stomach & intestine contents, blood. Yet day-to-day variation is likely dominated by these factors (exempting blood, perhaps). If you were to carefully control salt intake, carbohydrate intake, rate of exercise, caffeine, water, etc., then perhaps the variation in water & glycogen could be minimized (glycogen binds with water, so is effectively quite heavy). But few of us are willing to do these things.
The effect of this variation is that single-day weigh-ins are virtually meaningless. Consider Rider B:
day kg
-16 62.7
-4  62.8
If he'd weighed himself 16 days before the race, then again 4 days before the race, a 12-day interval, he'd conclude he'd not lost anything. Indeed, he'd gained 100 grams.
On the other hand, supposed he taken the following spot mass-checks:
day kg
-19 63.7
-6  62.1
This is a similar interval spanning 13 days, from 19 before the race to 6 before the race, and here it appears he's lost 1.6 kg during this time: more than 120 grams per day.
One can find similar examples with Rider C: pick a relatively low earlier day and a relatively high later day and you could substantially underestimate the rate of mass loss.
The moral? If you're trying to track structural mass loss, you need to weigh yourself often, for example every day, and then track trends, rather than compare individual measurements. Even if your structural mass hasn't changed, two individual measurements will typically differ from each other by around 1% of total body mass.
One obvious question, though, is how well these riders did in the race? They were losing the weight to climb as fast as possible, after all. While both did well in absolute terms, I think each rider wanted to do a bit better than that. In a climb of this duration, 15-17 minutes, anaerobic power can be up to 10% of total assuming the critical power model. So if you go in 10% depleted, that's around 1% of total power squandered, and for these riders 1% added power offsets close to 1 kg of extra mass (since wind resistance also plays a role power requirements are not strictly proportional to mass). So while the weight loss helped, I'd have been tempted to end the calories deficit maybe five days before the race to make sure I was fully loaded and ready to go on race day.


Comments
I was slightly surprised the RMS residuals were so close, since you might think one or the other would have taken more care in controlling variability, for example by eating a more consistent diet or practiced a more consistent hydration or been more consistent in weighing themselves before or after other morning activities. But the similarity, and the similarity of B's scatter before and after starting the calorie restriction, suggests to me this is a fairly typical result: day-to-day differences typically differ by around 1%, even if structural mass is unchanged.
Interesting to see how meaningful the trends are, despite identical weight values happening 2 weeks apart. I've been tracking weight with a body fat and water scale, and it seems to be spot on if the water percentage readings are the same. However, I've seen overall weight differences on the order you're seeing here, hydration is definitely a factor.
BTW, I didn't record R-squared. That is supposed to report the probability random chance could yield a similar result. I take Flannery and Press's "Chi By Eye" approach :). It looks like a good fit to my eye....