testing the Low-Key consistency ranking
After designing the "consistency ranking" (described in the last post) to avoid unfairly favoring riders who've done only two climbs, and have a better chance to "get lucky" with having those scores fall close together, I decided to run a little Monte Carlo test. A Monte Carlo test is one in which random numbers are generated, then an algorithm tested on those numbers, to see how the results are influenced by random variation in the data.
In this instance, I assumed the logarithm of each rider's score each week was selected at random from a unit-normal probability distribution centered at zero. I then generated scores for a hundred thousand riders for each number of weeks ridden from two through nine. The "true" standard deviation of each rider's score in this case is exactly one, but since I add two standard errors of my estimate to the estimate of the standard deviation, typical scores come out larger than one.
But before I plot results, initial experimentation led to some shocking results: that formula I've been using oh-so-many years to estimate the standard deviation of a population turns out to be biased! It turns out it was an unbiased estimator of the variance, but the square root of an unbiased estimator is not an unbiased estimator of the square root. Fortunately these days we have Wikipedia to set us straight. Simply replace the N ‒ 1 in the denominator with N ‒ 1.5 and you have what comes much closer to an unbiased estimate of the standard deviation. So that's what I did: the estimator for the standard deviation becomes:
S2 = ( s2 - s12 / N ) / (N - 1.5).
Live and learn, eh? So I apply that principle to the consistency score:
score = sqrt[ ( s2 - s12 / N ) / (N - 1.5) ] × ( 1 + sqrt [ 8 / (N - 1.5) ] ),
remembering that the sums s1 and s1 are over the natural logarithms of scores, rather than scores themselves.
So anyway the result of this is the mean score for each population comes close to the scale factor I apply to the now-almost-unbiased estimator of the standard deviation. That factor is plotted here (differing slightly from what I used in the preceding blog post):
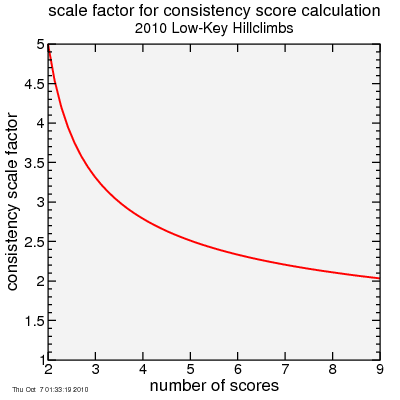
So this seems to favor riders who've done more climbs. However, not so fast. Given a large number of riders who have done each number of climbs, some will get lucky and get scores which happen to fall closer together than their natural consistency would predict. Those riding a smaller number of climbs might be more likely to get a particularly low score due to luck than those riding a larger number of weeks. Since in my test all riders were precisely equally consistent, I can simply count what fraction for each number of rides did better than a certain target score.
So for that target, I pick σ = 1. This is the score every rider in my little test would get doing an infinite number of weeks. So scoring better than 1 means you'd beat that rider doing an infinite schedule of Low-Keys.
Here's the fraction of riders scoring better than σ = 1 plotted versus the number or weeks ridden.
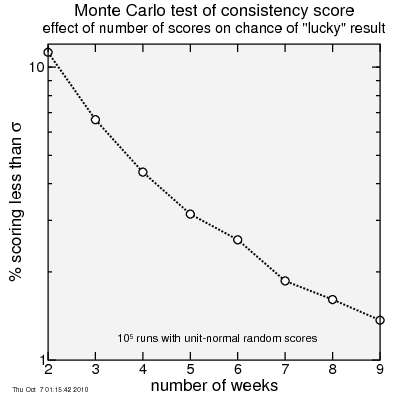
As you can see, the more climbs you do, the less likely you are to "get lucky".
So what do I conclude? One conclusion might be that the formula is total rubbish and should be scrapped. But perhaps an alternate conclusion is to use the formula anyway, but to limit the standings to riders who have ridden a minimum number of climbs. To qualify for a maximum overall score, I require riders to have ridden at least half the climbs, with the exception volunteers can ride one fewer climb if volunteering once or twice, two fewer climbs if volunteering three or more times. Applying this same restriction will help prevent riders from doing only two or three climbs and getting lucky on the consistency ranking.
In this instance, I assumed the logarithm of each rider's score each week was selected at random from a unit-normal probability distribution centered at zero. I then generated scores for a hundred thousand riders for each number of weeks ridden from two through nine. The "true" standard deviation of each rider's score in this case is exactly one, but since I add two standard errors of my estimate to the estimate of the standard deviation, typical scores come out larger than one.
But before I plot results, initial experimentation led to some shocking results: that formula I've been using oh-so-many years to estimate the standard deviation of a population turns out to be biased! It turns out it was an unbiased estimator of the variance, but the square root of an unbiased estimator is not an unbiased estimator of the square root. Fortunately these days we have Wikipedia to set us straight. Simply replace the N ‒ 1 in the denominator with N ‒ 1.5 and you have what comes much closer to an unbiased estimate of the standard deviation. So that's what I did: the estimator for the standard deviation becomes:
S2 = ( s2 - s12 / N ) / (N - 1.5).
Live and learn, eh? So I apply that principle to the consistency score:
score = sqrt[ ( s2 - s12 / N ) / (N - 1.5) ] × ( 1 + sqrt [ 8 / (N - 1.5) ] ),
remembering that the sums s1 and s1 are over the natural logarithms of scores, rather than scores themselves.
So anyway the result of this is the mean score for each population comes close to the scale factor I apply to the now-almost-unbiased estimator of the standard deviation. That factor is plotted here (differing slightly from what I used in the preceding blog post):
So this seems to favor riders who've done more climbs. However, not so fast. Given a large number of riders who have done each number of climbs, some will get lucky and get scores which happen to fall closer together than their natural consistency would predict. Those riding a smaller number of climbs might be more likely to get a particularly low score due to luck than those riding a larger number of weeks. Since in my test all riders were precisely equally consistent, I can simply count what fraction for each number of rides did better than a certain target score.
So for that target, I pick σ = 1. This is the score every rider in my little test would get doing an infinite number of weeks. So scoring better than 1 means you'd beat that rider doing an infinite schedule of Low-Keys.
Here's the fraction of riders scoring better than σ = 1 plotted versus the number or weeks ridden.
As you can see, the more climbs you do, the less likely you are to "get lucky".
So what do I conclude? One conclusion might be that the formula is total rubbish and should be scrapped. But perhaps an alternate conclusion is to use the formula anyway, but to limit the standings to riders who have ridden a minimum number of climbs. To qualify for a maximum overall score, I require riders to have ridden at least half the climbs, with the exception volunteers can ride one fewer climb if volunteering once or twice, two fewer climbs if volunteering three or more times. Applying this same restriction will help prevent riders from doing only two or three climbs and getting lucky on the consistency ranking.


Comments