SRM claims best power meter accuracy based on Triathlon magazine test
SRM claims to be the most accurate power meter according to a test done in Triathlon Magazine, a German publication. Here's a link to the PDF article (German).
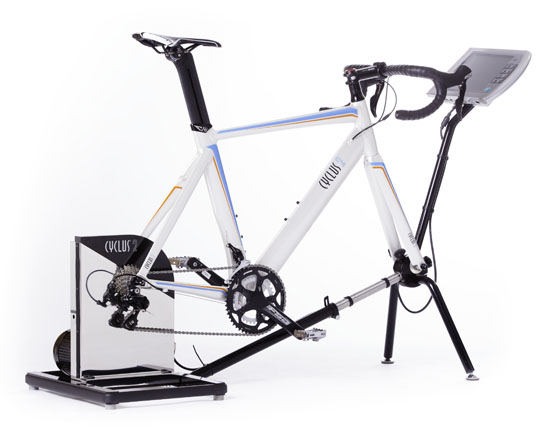
I can't understand German, but the second-hand report I read was that the various power meters were compared to a Cyclus 2 ergonometer. This is a trainer system after the LeMond trainer / Wahoo fitness model: it has a cassette to which the chain directly attaches, the trainer replacing the rear wheel:
Here were the results of "accuracy":
| place | power meter | accuracy |
|---|---|---|
| 1 | SRM FSA | 0.50% |
| 2 | SRM Campagnolo | -1.3% |
| 3 | Power2Max | -2.0% |
| 4 | Quarq/SRAM | 3.6% |
| 5 | Look/Polar | -4.0% |
| 6 | Rotor-3D | 6.1% |
| - | Powertap | ? |
The Powertap wasn't measured since it's built into a rear wheel, and the trainer replaces the rear wheel. They used a treadmill to test the Powertap, comparing it to the SRM, but didn't include the results in the data table since this was a different platform.
These results look strong for SRM, until you consider that each of these power measurement systems is measuring power at the crank, and for the powers used in the test (150, 200, 250, and 300 watts) drivetrain losses would typically be close to 3%. For example, I have data listed here.
Suppose I assume 3% drivetrain losses. Then the "correct" number is no longer the number measured by the ergonometer, but rather 3% higher. If I assume this, the test results become:
| place | power meter | accuracy |
|---|---|---|
| 1 | Quarq/SRAM | 0.6% |
| 2 | SRM FSA | -2.5% |
| 3 | Rotor-3D | 3.1% |
| 4 | SRM Campagnolo | -4.3% |
| 5 | Power2Max | -5.0% |
| 6 | Look/Polar | -7.0% |
| - | Powertap | ? |
Looking at the plots in the article, which are unfortunately at low resolution, I see there's some errant data points in some of the plots, including Quarq. I'm not going to worry too much about these because it's a well known issue with crank or pedal based systems that the Edge 500 (used in the test) expects power numbers each second, while the crank-based systems measure every pedal stroke, so there's synchronization issues which can be resolved in different ways. But to my eye the SRM/Campagnolo, Power2Max, and Polar/Look appear to have the smoothest curves. The Quarq, Rotor, and SRM/FSA have more noise. But producing smooth curves isn't necessary the goal.
Another issue here is we're assuming the ergonometer is accurate.
I'm not going to declare a winner here, but certainly the message I'd take from these numbers is Quarq is looking more like the result I'd expect. Look/Polar is looking poor, but I'm really not too surprised. I expected better from Power2Max, since it uses "instantaneous" instead of rotation-averaged cadence. If the ergonometer is inaccurate, or if it has a built in assumption about drivetrain losses, all bets are off.
I think a conservative interpretation of these results is you can't believe manufacturer accuracy claims, since each of these power meters claims 1.5% - 2.0% accuracy. They obviously differ from each other a lot more than this, assuming the ergometer is precise and stable.
Back to the Powertap: they had this to say, courtesy of Google translate:
They are set on a wheel, but it can be used on different wheels. Conclusion As in the lab test "Cyclus2" Laufräder can not be tested, this system underwent the examination stage twice on a treadmill, with reference power meters. Since the setting is not possible with the same accuracy as the "Cyclus2" was to let himself make any concrete statements. Is the basis of the measured values however, be assumed that the system is well suited for power measurement.
Visual assessment of the low-resolution plot looks like it did fairly well, with relatively constant power where expected.
addendum: The claimed accuracy of the ergometer is 2%. Suppose there's 1% uncertainty in my claimed 3% drive train loss. Then Quarq, SRM/FSA, and Rotor are all certainly in the ballpark for near-equal consideration on accuracy. It gets work if the ergometer has a built-in assumption about drivetrain loss, for example if it were calibrated against an SRM with a geared drivetrain (as opposed to a fixed drivetrain). But if it was calibrated against an SRM then the whole test is biased. So I'm not sure what to make of this. Let me just rank them from highest to lowest power measured:
| place | power meter | % mean |
|---|---|---|
| 1 | Rotor-3D | +5.6% |
| 2 | Quarq/SRAM | +3.1% |
| 3 | SRM FSA | 0.0% |
| 4 | SRM Campagnolo | -1.8% |
| 5 | Power2Max | -2.5% |
| 6 | Look/Polar | -4.5% |
| - | Powertap | ? |


Comments
Also, as you noted, it sounds like this was just a single test. No clarity around how the data was handled, etc...
It's virtually impossible to do a single test and make any sort of conclusions based on it. Trending is far more important. I could pick any single power meter test and show a vastly different outcome than another. Further, indoor riding (and testing) is really rather trivial (to pass). It's the outdoor testing that surfaces the really interesting stuff.
So what we can say from this test is that the different power meters disagree with each other. Which is the most trustworthy is left as an open question.
I am, BTW, a big fan of your tests. They're the best considering all aspects: indoor/outdoor, quantitative versus subjective, and an appreciation, analysis, and description of assumptions and limitations. This Triathlon article is a good example of where that is missing.
This reference was referenced on the wattage list as an example of a test against an independent measure. This earlier paper tests the SRM and finds that the accuracy is variable unit-to-unit, in the "good" science-grade units 2.5%. We see in the triathlon test even has two SRMs disagreeing with each other.
I think for meaningful conclusions to be drawn about absolute rather than relative accuracy tests with lab-grade rather than consumer-grade apparatus is needed.