San Francisco "summer"
It's been regularly chilly in San Francisco this past month. The marine layer blows fog in from the coast, and while it can be toasty warm in east of the Bay, on San Francisco streets sweaters, jackets, and scarves are common.
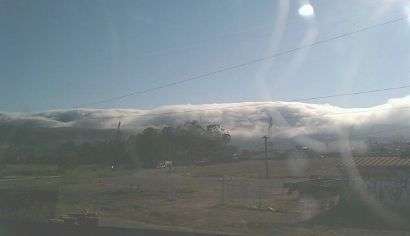
Here's a photo I took from the train on Sunday as the evening fog engulfs San Bruno mountain:

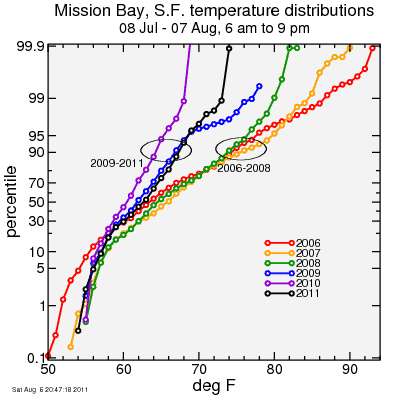
I wrote a little Perl script to download and process data archived on Weather Underground for Mission Bay, one of the warmest neighborhoods in San Francisco. Data are recorded every 15 minutes. For each of the years 2006-2011 for which data are available at that weather station, I took daytime (6 am to 9 pm) data from the period 08 July to 07 August (the past month as I write this) and binned the data between 6 am in 9 pm in 1 F bins. I then generated cumulative distribution plots for each year. So for each temperature I indicate the percentage of daytime samples which were less than the given temperature.

There's a clear pattern here. For 2006-2008, temperatures in the 70's where fairly common, with even some numbers reaching into the 80's. However, these last three years, 2009-2011, there've been no data in the '80's, and last year the temperature even failed to get out of the 60's during this one-month period. The median temperature, even at warm Mission Bay, was only 61F. This year it's almost 63F.

While the rest of the northern hemisphere laments the dog days of August marking the end of the hot summer, here the warmest months are September and October, when the fog has the least influence. Ironic that these hottest months mark the end of the road cycling season and the beginning of cyclocross.
So my standard dress on rides continues to be knickers or full tights with long-sleeve undershirts under my jersey with a vest. I actually enjoy the heat, at least to a limit, so I look forward to those September and October days when I can ride with just a jersey and shorts.
Here's a photo I took from the train on Sunday as the evening fog engulfs San Bruno mountain:

I wrote a little Perl script to download and process data archived on Weather Underground for Mission Bay, one of the warmest neighborhoods in San Francisco. Data are recorded every 15 minutes. For each of the years 2006-2011 for which data are available at that weather station, I took daytime (6 am to 9 pm) data from the period 08 July to 07 August (the past month as I write this) and binned the data between 6 am in 9 pm in 1 F bins. I then generated cumulative distribution plots for each year. So for each temperature I indicate the percentage of daytime samples which were less than the given temperature.

There's a clear pattern here. For 2006-2008, temperatures in the 70's where fairly common, with even some numbers reaching into the 80's. However, these last three years, 2009-2011, there've been no data in the '80's, and last year the temperature even failed to get out of the 60's during this one-month period. The median temperature, even at warm Mission Bay, was only 61F. This year it's almost 63F.

While the rest of the northern hemisphere laments the dog days of August marking the end of the hot summer, here the warmest months are September and October, when the fog has the least influence. Ironic that these hottest months mark the end of the road cycling season and the beginning of cyclocross.
So my standard dress on rides continues to be knickers or full tights with long-sleeve undershirts under my jersey with a vest. I actually enjoy the heat, at least to a limit, so I look forward to those September and October days when I can ride with just a jersey and shorts.

Comments
Since I have the script written, I may compare the weather here to some other places on the same weather data base.
Yesterday i rode PA->Pesky->PA ride and 3 hours in the *rain*; only to have that last hour coming down hwy 84 in warm sunshine. Where else can you get that?!
bitch as one may, apparently there is a lot *less* fog these days -
http://science.kqed.org/quest/video/science-on-the-spot-science-of-fog/