Low-Key scoring algorithm: addition of variance normalization
As always happens in fall, the Low-Key Hillclimbs have taken up a large chunk of my time, leaving less time for blog posts. But it was worth it: the series was an unqualified success, with every climb coming off well, the last few finding valuable seams in the weather. At Hamilton riders experienced moderate rain on the descent, and for some towards the end of the climb, but it was warm enough that the long descent was still tolerable in the wet.
One aspect of the series worthy of revision, however, is the scoring system. Never before were artifacts in the median-time-normalized scoring more obvious. So for 2012, I am finally overcoming inertia and changing from the median-based scoring we've essentially used since 2006.
I've described in preceding posts a scheme to calculate a reference "effective" time for each climb. With this scheme, instead of taking a median each week, we take a geometric mean where effective times for riders (adjusted for male, female, hybrid-electric) are adjusted by the rider's "rating", which represents how the riders tend to do relative to the reference time. It's an iterative calculation which is repeated until rider ratings and reference times are self-consistent, weighting means by heuristic weighting factors to give higher priority to riders who do more climbs, and climbs with more riders, since these provide better statistics.
Here's a comparison of this approach with the median-based system used this year. I plot on the x-axis each rider's rating and on the y-axis that rider's score for each designated week. In this case I used weeks 5 (Palomares Road) and 6 (Mix Canyon Road). These climbs are at opposite ends of a spectrum: Palomares is short with plenty of low-grades, while Mix Canyon is relatively long with extended steep grades.
Here's the plots. I've omitted riders who did only one climb, as for them their rating from the one climb they did is equal to their rating.
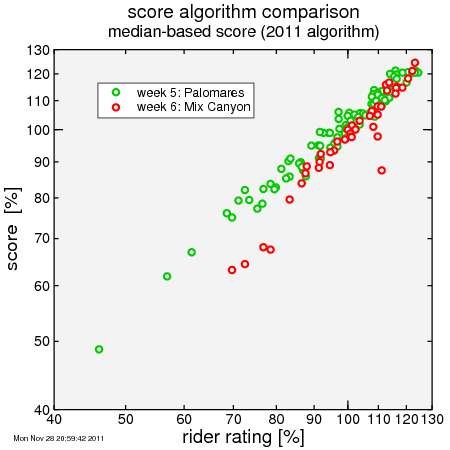
With the 2011 scoring scheme, you can clearly see that there is a lack of low-weighted riders relative to Palomares. As a result, moderately-rated riders in particular were given low scores, since the median rider was, relative to the entire series, above average (rated over 100). In contrast at Palomares there were more low-weighted riders.
So then I replace the median time with a reference time, adjusting each rider's effective time by his/her rating. Now you can see the scores for Mixed Canyon have been boosted:
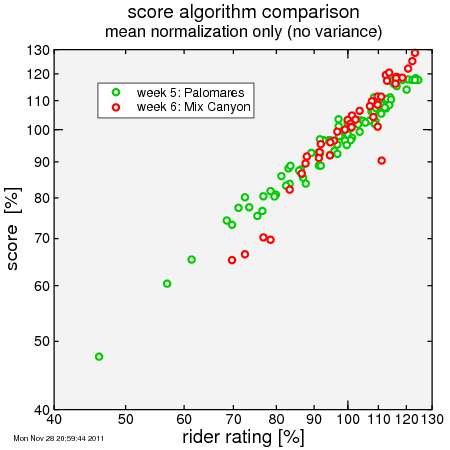
But there's an issue here: the curve for Mix Canyon is steeper. So relatively slower riders score lower, while relatively faster riders score higher, then they did or would at Palomares. So I added a bit of complexity: I compare the spread in scores with the spread in rider ratings and I make sure that the ratio of these spreads is the same week-after-week. I call the adjustment factor the "slope factor". The result is here:
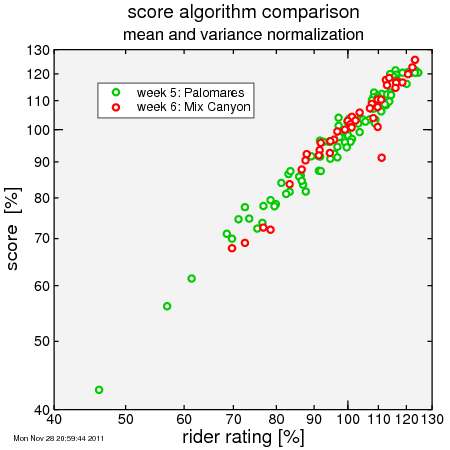
Now the curves line up nicely! Sure, each rider may score in a given week more or less than his rating, but the overall trend is very similar.
I'll add in the other weeks. First, here's the 2011 formula:
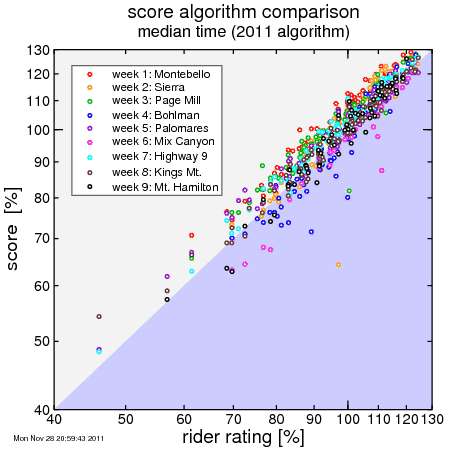
You can see distinct curves for different weeks. Some weeks a rider of a given ability is more likely to score higher, some lower. This isn't what we're after, as we want riders to have the opportunity to excel on any week.
So I add in the adjusted effective reference time, and then the slope factor, and here's what we get:
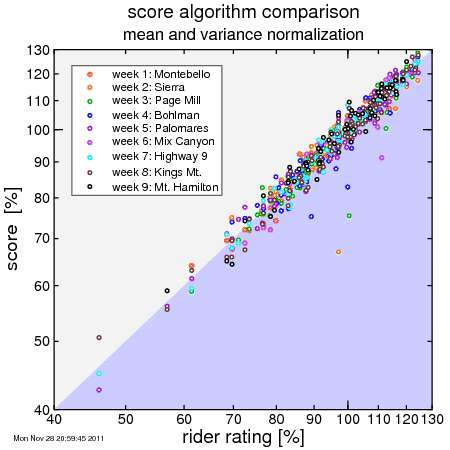
All of the weeks have generally overlapping curves. No more fear of turning our for a tough climb or a climb in difficult conditions, and have your score buried in obscurity because there's a disproportionate number of fast riders. Or similarly, no more volunteering for a week only to have your volunteer score end up lower than riders you finish ahead of week after week, simply because the median times were relatively long due to rider turn-out.
To me, this system looks like it's working nicely.

Comments