Posts

Showing posts from January, 2014

adding dynamic damping to nonlinear least square fitting of modified Veloclinic power-duration model

Previously I used a damping factor δ for the nonlinear fitting of the modified Veloclinic power-duration model. This resulted in me fitting 28 out of 29 test cases when I set δ = 0.25. But δ = 0.25 is too small: it means at best 25% of the progress toward the solution is covered with each iteration. That's inefficient when homing in on the result. The real issue is when the solver isn't homing in on the result: when the solution is still substantially off and the solver it attempting to make a big leap toward the solution. The big leap could easily overshoot the desired solution, or be in a slightly wrong direction in the hyperdimensional parameter space. In such instances, it's better to take smaller steps toward the solution, to home in on the the "zone of quadratic convergence" where the targeting becomes easier. For that I introduced a dynamic weighting scheme multiplying the primary damping factor by a factor dependent on the step size of the parameters.

envelope fits of modified Veloclinic model using nonlinear least squares with iterative weighting

Image
I've described everything needed to implement the fitting algorithm to the Veloclinic model . All that remained was to tune the parameters. I started with a CP-model fit, yielding parameters CP and AWC. I used these to generate initial guesses for the VC model parameters. P 2 = CP, then I set τ 2 = 24000 seconds (an arbitrary value), then P 1 = 1-second power - CP, then τ 1 = AWC / P 1 . It's important with nonlinear fits to have a good initial guess, and this seems to get close enough for the algorithm to find its way. Then there's the question of the damping factor and the weighting factor. A damping factor of 0.5 works fairly well, but I relaxed it to 0.25, which results in slow convergence but helped in one difficult case. Then there's the weighting factor. 10 thousand yields a nice envelope fit, but I relaxed it to 1000 because this also helped the fit converge. Here's results generated from 28 datasets I had laying around. In one dataset the alg

Parameter choice for optimal model fitting

I implemented the nonlinear least-square fitting scheme I described, and it didn't work. That is, it didn't work until I fixed it. The initial problem was the parameter choice. This is a classic problem with iterative fitting schemes: parameters which may span a broad range of values, yet which are restricted to being strictly positive (or equivalently, strictly negative) are often best not fit directly. Instead it may be smarter to fit their logarithm, then take the exponential of the result to restore the original parameter. Exponentials are strictly positive, so the logarithm maps the positive numbers to the full range of real numbers, so it's more robust. Additionally, the logarithm increases the significance of differences of small values, decreasing the significance of the same absolute difference of large values. This is typically what is wanted: the difference between τ = 1 and τ = 2 is probably more significant than the difference between τ = 24000 and τ = 24

fun with PERL Math::Matrix

Wanting to do some matrix math, I installed the Math::Matrix module from CPAN . There's some nice instructions on installing CPAN modules on about.com . A common tool people use for matrix manipulation is MATLAB . I'm deeply embarrassed I have virtually no skills in MATLAB. However, this module is pretty cool. What makes it so nice it is uses overloading of the basic mathematical operators. So that makes it easy to add, subtract, and multiply matrices, as well as a string conversion when it's accessed in a scalar context. Here's an example: use Math::Matrix; use strict; my $a = new Math::Matrix ([1, 0, -1], [-1, 1, 0], [0, -1, 1]); warn("a =\n$a\n"); my $at = $a->transpose; warn("at =\n$at\n"); warn("at * a =\n", $at * $a, "\n"); The result: a = 1.00000 0.00000 -1.00000 -1.00000 1.00000 0.00000 0.00000 -1.00000 1.00000 at = 1.00000 -1.00000 0.00000 0.00000 1.00000 -1.0000

differentiating the Veloclinic model for nonlinear least-squares fitting

Two posts ago I described fitting the linear CP model with an iteratively weighted least-square fit to approximate an envelope fit. The weights were either 1/t 2 for points falling under the CP curve or 10k/t 2 for points falling above the CP curve. This did a decent job in the example I showed of matching the fit using a 2-point method used in Golden Cheetah. But of greater interest is using this method for my modified Veloclinic model. That model should do much better at fitting the full time spectrum of the power-duration data. The challenge there, however, is the model is nonlinear. Nonlinear least squares fitting is described by Wolfram . In my last posts, I added weighting to the method described on the Wolfram page. Nonlinear least square fitting is a matter of navigating a hyperdimensional space, looking for the point where all error terms go to zero (where the model perfectly fits the data). There is no such point, so you search for it until improvement slows below s

adding weights to nonlinear least squares algorithm

Note: this uses MathML code produced by OpenOffice. It doesn't seem to work on Internet Explorer. It's also been rejected by Chrome . But it works on Safari, Chromium, and Firefox. Nonlinear least-square fits are done with a Jacobian Matrix, which describes the linearized dependencies of the model, evaluated at each of the points, on each of the model parameters.  In this case I show two parameters, τ 1 and τ 2 .  I like writing these things out, rather than using index notation, because index notation is a bit abstract.  In the following, f is a function of time t representing the model to be fit. A = ∂ f ∂ τ 1 ∣ t 1 ∂ f ∂ τ 2 ∣ t 1 ∂ f ∂ τ 1 ∣ t 2 ∂ f ∂ τ 2 ∣ t 2 ⋮ ⋮ ∂ f ∂ τ 1 ∣ t N − 1 ∂ f ∂ τ 2 ∣ t N − 1 ∂ f ∂ τ 1 ∣

Fitting Critical Power model with iteratively weighted linear least squares

Image
Now that I've establish envelope fitting can be done using an iteratively weighted least-square fitting scheme, the weights set larger for points falling above the model than below, I want to apply that approach to power-duration data. A nice thing about this is I no longer need to partition the points into discrete regions for each model parameter. I can fit the whole curve. But I need to do that smartly. First, there's point decimation. It's natural to plot power-duration data on a logarithmic time axis. For example, the points falling between 1000 and 2000 seconds should have about the same significance as the points between 100 and 200 seconds. Each of these sets represents a factor of two in duration difference. However, with points derived on a second-by-second basis, there would be 10 times as many points in the 1000 to 2000 range as there were in the 100 to 200 range. When doing a regression, the longer time data would thus exert far greater influence. Thi

envelope fits using iteratively weighted least-squares regression

Image
I've noted an issue with fitting power-duration curves is that there is a lack of quality data, and the challenge is to focus on the data of the highest quality. Only at a few time durations will the data represent the best possible effort available from the rider, at other durations more power was possible. So to fit a model to the data, what I call an "envelope fit" is wanted. The fitted curve should encapsulate the measured points, hugging the data as closely as possible, such that the points generally form under the curve or on the curve but not above the curve. I showed for the critical power model, with two parameters, that a reasonable fit to data with sufficient quality can be attained by searching for two "quality points" and doing an exact fit through those points. To independently fit the two parameters, subsets of the available time points are chosen, for example 1-6 minutes for anaerobic work capacity and 10-60 minutes for critical power. This

automated fitting of the VeloClinic model: fail

Image
I developed an automated fitting algorithm for the Veloclinic power-duration model, or rather the variant that I described in this blog, with the addition of a square root term on the time dependence of the aerobic power. Or at least I tried. First I test it against the model itself. I first created an "ideal" power-duration curve with the following Perl snippet: my @pmax; for my $t ( 1 .. $duration ) { push @pmax, $P1 * ($tau1 / $t) * (1 - exp(-$t / $tau1)) + $P2 * sqrt($tau2 / $t) * (1 - exp(- sqrt($t / $tau2))); } Then I created 3 hours of ride data and ran it through my fitting program. The plot is from my "quick and dirty" plotting program of choice, xgraph. The axes aren't so clear: the "x-axis" is time in seconds on a logarithmic scale, and the "y-axis" is power in watts. Two fits are shown, one for the CP model and the other for the Veloclinic model. The fit to the Veloclinic model is essentially pe

next trail race: Lake Chabot 30 km

Image
The next trail race on my list is the Lake Chabot Trail Run by Inside Trail Racing. This seems to be my year for Inside Trail racing. That just worked out based on the race calendar. In a moment of weakness I chose to accept the technical T-shirt. I'm down one technical T after leaving one somewhere; I don't recall at the moment where. At my last race, the Inside Trail Racing's Pacific Foothills race at Montara Mountain, I ended up wearing my wool undershirt after I accidentally started pinning my number to it and then just decided to go with it. It's January and way too warm for two layers. Not normal. The biggest concern about using the wool shirt is pinning numbers leaves damage, and I really like the shirt. Better to shred my race technical T's. As an aside, both of my technical race T's fit me like a tent. I think the point of these shirts is to wear them in a race, and in a race, wind resistance slows you down. That means shirts should be form-

some of my favorite pro cycling things

Image
Favorite pro racing helmet POC. I really like the design concept: to make a helmet which is race-light but goes beyond the minimal standards of the usual tests. It puts material on the temples and lower back of the head where it will do some good, avoids sharp angles which could twist the head and contribute to concussions, and it comes available in an orange color which flaunts fashion in the name of visibility. Plus it's round, which should fit my head, although I have yet to see one let alone try one on. Favorite pro racing bike frame Not counting fit issues, it has to be the Cervelo R5. In particular, the R5-CA, but the R5 is close enough to have some of the credit for that $10k frame to rub off. The Cervelo white paper on the R5-CA design is really extraordinary: a wonderful balancing of aerodynamics, stiffness where it's wanted (not where it's not), and light mass. I'm not sure about the head tubes, but if the bike fits you... BTW, I also like the Cann

selling pedals

Image
When I got fit at 3D Bike Fit , it was recommended I switch from Speedplay to Shimano pedals due to the more stable platform and greater resistance to pedal wear. I gave these a try, and indeed the feeling of connectedness was palpable. I expected to feel claustrophobic, accustomed to the freedom of Speedplay's rotational float over many years, but with Kevin Bailey's expert cleat placement, my foot was where it wanted to be and there was no need for it to be anywhere else. As long as I didn't think about the fact my foot was constrained, I was fine. And the pedals were light (248.0 grams on my scale), especially considered in combination with the cleat hardware, which is much lighter than a Speedplay cleat with adaptor plate (although I have no adaptor plate on my Bont Speedplay-drilled shoes). The only time I noticed the constrained position was when coasting. I found that when I coasted, I liked to move my foot around a bit to stretch the muscles. This isn't

Inside Trail Racing Pacific Foothills Half-Marathon

Image
I was shocked when I looked back through this blog and observed that it had been two and a half years since my last trail race, the Golden Gate 30 km by Coastal Trail Runs. I remember that run well: the pain of the wrong turn, breaking down toward the finish. Two and a half years? Where had the time gone? Obviously, I've not been idle, but between cycling events, road running events, and a few unfortunate injuries focus drifts and suddenly you open your eyes and the year has jumped 3 digits. Clearly I had to fix this. And so after an extended period of bikeless December travel where running became my only outlet for self-exertion, I decided to continue the momentum through early 2014. Goals: it's important to have goals. With each year it's important to try for something new and challenging, something outside the comfort radius, something which will be hard. And an anomalous addiction to Ultra Running Magazine has me telling myself that a marathon distance is just

"20 is plenty" in San Francisco?

Image
San Francisco Bike Coalition and San Francisco announced a new program, Zero Vision , for a nominal goal of zero tolerance for pedestrian deaths. The idea is to shift the perception that pedestrian deaths are an acceptable cost of doing business, that crossing the street is an activity like skydiving or smoking where the risk of death is implicitly accepted. But it's mostly hot air. Looking at the article, the term "speed" isn't to be found at all. The #1 risk factor for pedestrians is vehicle speed. Going from 20 mph to 40 mph increases the risk of pedestian fatalities by approximately 17 times . Perhaps it's perceived promoting slower vehicle speeds is politically unrealistic. I don't give a crap. If you're serious about safety, then it's important safety be given a priority. And what's the cost of lower speed? Consider an example of a driver crossing the city at either 35 mph or 25 mph maximum speed. San Francisco is approximately a 7

Mark Cavendish bike fit: 2011 vs 2014

Image
According to a recent CyclingNews article , Mark Cavendish downsized from a 52 cm to a 49 cm Specialized Venge this year. The article quotes Specialized Body Geometry fit manager Sean Madsen: "One thing about Cav is that he likes to periodically change his position around, based entirely on his feeling," Madsen said. "He may change it back in a couple of weeks, when his mood changes!" So did he change his position? Here's some BikeRadar/CyclingNews reviews of Cavendish bikes: 2011 2013 2014 I took the 2011 and 2014 side shots. Unfortunately these are from relatively different camera positions. To compensate, I did a combination of image scalings, rotations, and perspective transformations on the images to match the bottom bracket positions and the heights of the front and rear tires. This is 3 transformations for 3 constraints. It's not enough to fully match the photos, but it's a lot better than taking them unprocessed. I aligned the fro

tracking my running training load

Image
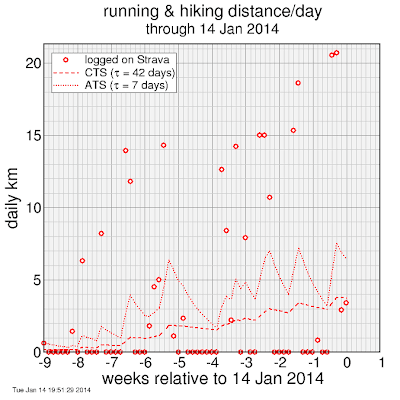
It's been only a bit over two weeks since I tracked my running training load last , but with my first trail race in two and a half years coming up this weekend (how did I let it go so long?) I wanted to update the plot. It can be hard to assess how it's going from feel. I run a bunch, rest, run a bunch more, rest... weekly miles tell a story, but only crudely. For a better view I borrowed some metrics from Andrew Coggan, typically applied to calculations from cycling power, ATS and CTS. In lieu of Coggan's effective workload numbers, I use running kilometers. This is crude, but tells a story. The metrics are a 7-day exponentially weighted average for ATS, and a 42-day exponentially weighted average for CTS. ATS represents fatigue, CTS represents accumulated fitness. Here's the new plot: Sure enough, while ATS is spiky, CTS keeps slowly ramping upward. The peak spikes of the ATS are similar, but they're getting closer together. In addition my runs have b

Team Low-Key ready for greatness

Image
This whole jersey design thing is addictive. I've really got to move on... but at least Team Low-Key is ready for greatness:

POC Octal helmet

Image
Garmin-Sharp previewed the new POC Octal helmet in the early 2014 races in New Zealand and Australia. Here's Jack Baur finishing second in the sprint in the New Zealand championships in Christchurch: I love what I see on the POC: round shape should fit my head, light weight (195 g for medium), more padding in the temple area and the lower back of the head, and rounded profile which should reduce twisting moments which contribute to brain trauma and concussions. It seems to have it all, other than being soberingly expensive ($270 retail). Well, everything except aerodynamics. I was told it could be a dog in the windtunnel, something which Jack might be regretting in that photo, as he gets beaten to the line by Hayden Raulston. But POC also has an aerodynamic version, the Octal Aero . Here's a comparison: I've read the two are equivalent, except Octal used a cover on the vents in the Aero. To test this, I superposed the profiles, making the Octal red and the Aer

path to 50 km

A new year's resolution for this year was to race a 50 km trail run. Not just finish a 50 km, that can be done by walking all of the uphills, running the downhills, and jogging the flats. I want to run the whole thing (power walking is fine on steep climbs: it's just as fast and more efficient). I did a 19 km trail run Saturday 4 Jan following a 15 km road run the day before. My next run wasn't for another week, due to fatigue, at least in part likely allergies.But it's good to occasionally rest. And when I finally felt ready to go again, paranoid I'd lost all my fitness, fat and out of shape, I went out for a 20 km run where once I got the kinks out I actually felt fairly good. So it's clear I've got a half-marathon in me. So the next rung in my ladder is my first trail run race since my injury: Inside Trail Racing's Montara Mountain half marathon. This will be my first run by Inside Trail Racing. It will be interesting to see how their promo

2014 Strava-Marc Pro jersey

Image
I love this jersey design: the 2014 Strava-Marc Pro team, based in northern California: As an aside, the jersey is done by Jakroo , the northern-California-based company which also did the WeightWeenies jersey, and which I plan to use for the Low-Key Hillclimbs jersey . I really like my Weightweenies jersey: it fits snugly without being tight. It's a perfect race jersey for me. Unfortunately I can't wear it in sanctioned races. Bill Bushnell photo On the subject of Strava , I'm a bit disappointed that they dropped me from their Ambassador program this year without any notice (starting 1 Jan, I was back to "premium"). But after they stopped sponsorship of Low-Key Hillclimbs of which hey were an enthusiastic supporter, stopped sponsorship of my cycling club, and now this, I'm naturally a bit less of a fan. Maybe it's a natural consequence of their amazing growth. And it's important to handle disappointment.

Sky switch from SRM to Stages

Image
When you think about power meters what professional team comes to mind? Only one... Indeed, there's a web site devoted to photos of Chris Froome looking at stems . Staring at his SRM display, many have claimed. Sucking the humanity of out racing by reducing it to pre-programmed efforts determined by power analysis? Hardly, obviously, but traditionalists always oppose change. He even does it in Pro Cycling Manager , a video game: So it's a major change in the world as we know it when it's leaked that for 2014, Sky is discarding their trusty SRMs for Stages power meters: Stages measures power on only the left leg, assuming the right leg is the same. This, not surprisingly, results in errors. I looked at Stages power data in this blog post . For example, comparing Stages power / 2 to Vector left-leg power is a good match, according to DC Rainmaker's data: But compare it to the Vector right leg data, and things get uglier: It typically takes two legs