Comparing the Terrible Two, Climb to Kaiser, and Death Ride: Peak Climbing Segments
Today I'll take another look at the route data from the Death Ride, Climb to Kaiser, and the Terrible Two.
Here for each climb I first map the data onto a 50 meter grid, then slightly smooth it using an estimated 15 second time constant (the same as when I calculate a climb rating), then I map it back to a 50 meter point separation (since smoothing disturbs this at the beginning and end of the ride) then I calculate the total climbing (with zero threshold) between each pair of points on the route. For each segment length (which is the number of contiguous points minus one multiplied by 50 meters) I find the segment which maximizes this total climbing.
The only efficiency trick is if I have a given segment length, I don't need to calculate it fresh each time: if I start with the segment from points 1000 to 2000 (length 50 km), and I want to calculate the climbing from points 1001 to 2001, I take the previous sum, subtract the climbing from 1000 to 1001, and then add the climbing from 2000 to 2001. Similarly, if I have the climbing from points 1 to 2000, and I want to calculate the climbing from points 1 to 2001, I need only add the climbing from 2000 to 2001, saving a lot of time.
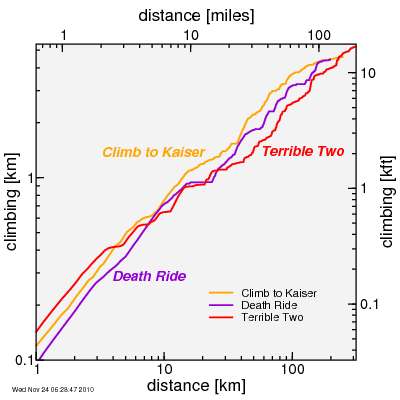
Anyway, here's the result for the three climbs:

So up to around 30 km, the Terrible Two has the steepest segments, then from 30 km to 160 km the Climb to Kaiser has the greatest climbing density, then the Death Ride catches climb to Kaiser. They're fairly well matched to the point the Death Ride ends at 200 km, then Climb to Kaiser adds a bit more until it comes to a merciful halt at 250 km. The Terrible Two matches Climb to Kaiser over the same distance but overtakes it with a sheer volume which lasts out to 314 km.
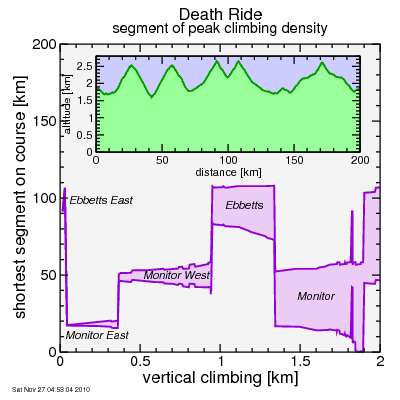
Also of substantial interest is where these peak climbing segments fall. So for each amount of climbing, I plotted a band showing where the shortest segment containing that amount of climbing is. First, the Death Ride:

So the steepest short stuff is on Ebbetts East. For a bit longer, it moves to Monitor East and then to Monitor West. Beyond 940 meters or so you need combinations: first the Ebbetts pair, then the Monitor pair, then finally (on the range of the plot) to Monitor-Ebbetts-Ebbetts.
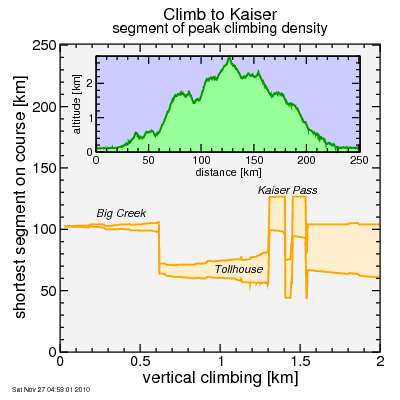
Here's the same analysis applied to Climb to Kaiser:

Obviously the nastiest grades are at Big Creek. For more climbing you go to Tollhouse. And for more still, start at Big Creek and go all the way to Kaiser summit. If you run out of climbing here (Big Creek is preceded by a descent) you go from Tollhouse and continue past Shaver Lake.
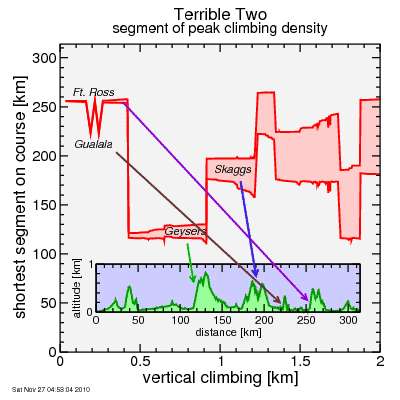
Finally, Terrible Two:

For shorter segments, Gualala and Fort Ross compete for the steepest. For longer, you go to the Geysers. If you run out of room there, the repeated climb-descent segments of Skaggs Springs are the densest climbing. After this you get into more extended combinations.
Anyway, I like this analysis, and will likely add it to the pages for future Low-Key events.
Here for each climb I first map the data onto a 50 meter grid, then slightly smooth it using an estimated 15 second time constant (the same as when I calculate a climb rating), then I map it back to a 50 meter point separation (since smoothing disturbs this at the beginning and end of the ride) then I calculate the total climbing (with zero threshold) between each pair of points on the route. For each segment length (which is the number of contiguous points minus one multiplied by 50 meters) I find the segment which maximizes this total climbing.
The only efficiency trick is if I have a given segment length, I don't need to calculate it fresh each time: if I start with the segment from points 1000 to 2000 (length 50 km), and I want to calculate the climbing from points 1001 to 2001, I take the previous sum, subtract the climbing from 1000 to 1001, and then add the climbing from 2000 to 2001. Similarly, if I have the climbing from points 1 to 2000, and I want to calculate the climbing from points 1 to 2001, I need only add the climbing from 2000 to 2001, saving a lot of time.
Anyway, here's the result for the three climbs:

So up to around 30 km, the Terrible Two has the steepest segments, then from 30 km to 160 km the Climb to Kaiser has the greatest climbing density, then the Death Ride catches climb to Kaiser. They're fairly well matched to the point the Death Ride ends at 200 km, then Climb to Kaiser adds a bit more until it comes to a merciful halt at 250 km. The Terrible Two matches Climb to Kaiser over the same distance but overtakes it with a sheer volume which lasts out to 314 km.
Also of substantial interest is where these peak climbing segments fall. So for each amount of climbing, I plotted a band showing where the shortest segment containing that amount of climbing is. First, the Death Ride:

So the steepest short stuff is on Ebbetts East. For a bit longer, it moves to Monitor East and then to Monitor West. Beyond 940 meters or so you need combinations: first the Ebbetts pair, then the Monitor pair, then finally (on the range of the plot) to Monitor-Ebbetts-Ebbetts.
Here's the same analysis applied to Climb to Kaiser:

Obviously the nastiest grades are at Big Creek. For more climbing you go to Tollhouse. And for more still, start at Big Creek and go all the way to Kaiser summit. If you run out of climbing here (Big Creek is preceded by a descent) you go from Tollhouse and continue past Shaver Lake.
Finally, Terrible Two:

For shorter segments, Gualala and Fort Ross compete for the steepest. For longer, you go to the Geysers. If you run out of room there, the repeated climb-descent segments of Skaggs Springs are the densest climbing. After this you get into more extended combinations.
Anyway, I like this analysis, and will likely add it to the pages for future Low-Key events.

Comments